Finnish Self-Care Disability
COMPARE
Finnish
Select to Compare
Self-Care Disability
Finnish Self-Care Disability
2.4%
SELF-CARE DISABILITY
67.0/ 100
METRIC RATING
160th/ 347
METRIC RANK
Finnish Self-Care Disability Correlation Chart
The statistical analysis conducted on geographies consisting of 404,111,559 people shows a moderate positive correlation between the proportion of Finns and percentage of population with self-care disability in the United States with a correlation coefficient (R) of 0.406 and weighted average of 2.4%. On average, for every 1% (one percent) increase in Finns within a typical geography, there is an increase of 0.037% in percentage of population with self-care disability.
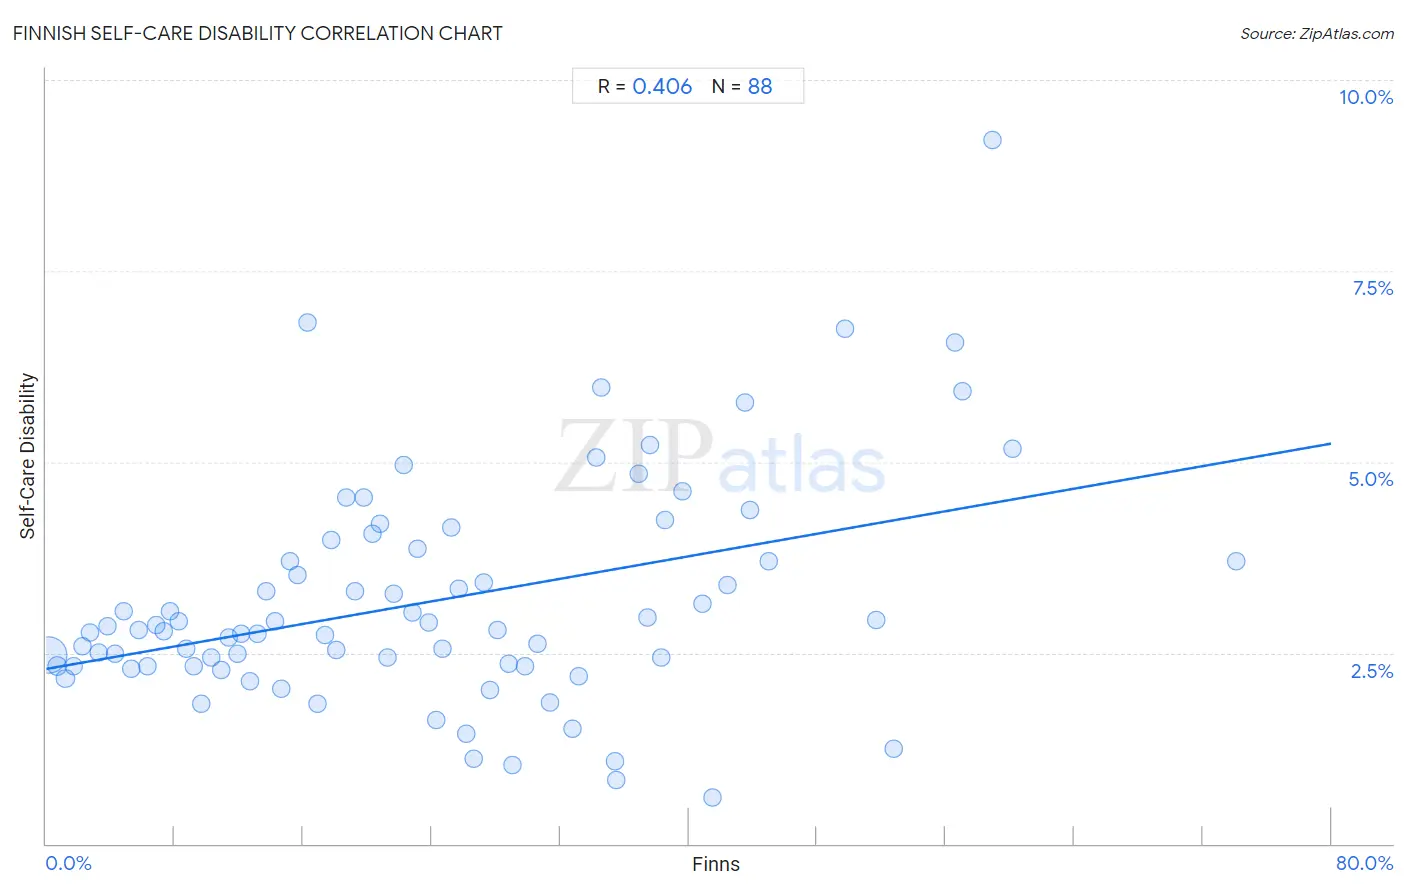
It is essential to understand that the correlation between the percentage of Finns and percentage of population with self-care disability does not imply a direct cause-and-effect relationship. It remains uncertain whether the presence of Finns influences an upward or downward trend in the level of percentage of population with self-care disability within an area, or if Finns simply ended up residing in those areas with higher or lower levels of percentage of population with self-care disability due to other factors.
Demographics Similar to Finns by Self-Care Disability
In terms of self-care disability, the demographic groups most similar to Finns are Lebanese (2.4%, a difference of 0.030%), Immigrants from Italy (2.4%, a difference of 0.080%), Immigrants from Western Europe (2.4%, a difference of 0.090%), Immigrants from Europe (2.4%, a difference of 0.14%), and Somali (2.5%, a difference of 0.17%).
| Demographics | Rating | Rank | Self-Care Disability |
| Immigrants from England | 73.5 /100 | #153 | Good 2.4% |
| Italians | 72.2 /100 | #154 | Good 2.4% |
| Pakistanis | 71.4 /100 | #155 | Good 2.4% |
| Nigerians | 70.6 /100 | #156 | Good 2.4% |
| Immigrants from Europe | 69.6 /100 | #157 | Good 2.4% |
| Immigrants from Western Europe | 68.6 /100 | #158 | Good 2.4% |
| Immigrants from Italy | 68.5 /100 | #159 | Good 2.4% |
| Finns | 67.0 /100 | #160 | Good 2.4% |
| Lebanese | 66.5 /100 | #161 | Good 2.4% |
| Somalis | 63.7 /100 | #162 | Good 2.5% |
| German Russians | 62.7 /100 | #163 | Good 2.5% |
| Immigrants from Vietnam | 59.3 /100 | #164 | Average 2.5% |
| Syrians | 59.0 /100 | #165 | Average 2.5% |
| Canadians | 58.8 /100 | #166 | Average 2.5% |
| Immigrants from Greece | 57.3 /100 | #167 | Average 2.5% |
Finnish Self-Care Disability Correlation Summary
| Measurement | Finnish Data | Self-Care Disability Data |
| Minimum | 0.14% | 0.60% |
| Maximum | 74.1% | 9.2% |
| Range | 73.9% | 8.6% |
| Mean | 24.0% | 3.2% |
| Median | 22.0% | 2.8% |
| Interquartile 25% (IQ1) | 11.1% | 2.3% |
| Interquartile 75% (IQ3) | 35.0% | 3.8% |
| Interquartile Range (IQR) | 23.9% | 1.5% |
| Standard Deviation (Sample) | 16.2% | 1.5% |
| Standard Deviation (Population) | 16.1% | 1.5% |
Correlation Details
| Finnish Percentile | Sample Size | Self-Care Disability |
[ 0.0% - 0.5% ] 0.14% | 357,463,710 | 2.5% |
[ 0.5% - 1.0% ] 0.68% | 31,708,070 | 2.3% |
[ 1.0% - 1.5% ] 1.20% | 8,160,672 | 2.2% |
[ 1.5% - 2.0% ] 1.70% | 2,743,168 | 2.3% |
[ 2.0% - 2.5% ] 2.24% | 1,181,619 | 2.6% |
[ 2.5% - 3.0% ] 2.75% | 613,333 | 2.8% |
[ 3.0% - 3.5% ] 3.25% | 473,684 | 2.5% |
[ 3.5% - 4.0% ] 3.78% | 165,164 | 2.8% |
[ 4.0% - 4.5% ] 4.25% | 255,760 | 2.5% |
[ 4.5% - 5.0% ] 4.79% | 94,809 | 3.0% |
[ 5.0% - 5.5% ] 5.30% | 86,405 | 2.3% |
[ 5.5% - 6.0% ] 5.79% | 144,822 | 2.8% |
[ 6.0% - 6.5% ] 6.28% | 176,212 | 2.3% |
[ 6.5% - 7.0% ] 6.81% | 78,034 | 2.9% |
[ 7.0% - 7.5% ] 7.29% | 73,049 | 2.8% |
[ 7.5% - 8.0% ] 7.74% | 34,492 | 3.0% |
[ 8.0% - 8.5% ] 8.25% | 38,729 | 2.9% |
[ 8.5% - 9.0% ] 8.68% | 55,200 | 2.6% |
[ 9.0% - 9.5% ] 9.21% | 37,633 | 2.3% |
[ 9.5% - 10.0% ] 9.62% | 29,903 | 1.8% |
[ 10.0% - 10.5% ] 10.30% | 33,515 | 2.4% |
[ 10.5% - 11.0% ] 10.87% | 70,239 | 2.3% |
[ 11.0% - 11.5% ] 11.36% | 31,244 | 2.7% |
[ 11.5% - 12.0% ] 11.92% | 48,637 | 2.5% |
[ 12.0% - 12.5% ] 12.15% | 24,440 | 2.7% |
[ 12.5% - 13.0% ] 12.66% | 18,363 | 2.1% |
[ 13.0% - 13.5% ] 13.18% | 10,503 | 2.7% |
[ 13.5% - 14.0% ] 13.69% | 9,374 | 3.3% |
[ 14.0% - 14.5% ] 14.27% | 14,502 | 2.9% |
[ 14.5% - 15.0% ] 14.61% | 12,734 | 2.0% |
[ 15.0% - 15.5% ] 15.18% | 5,403 | 3.7% |
[ 15.5% - 16.0% ] 15.68% | 2,615 | 3.5% |
[ 16.0% - 16.5% ] 16.30% | 3,853 | 6.8% |
[ 16.5% - 17.0% ] 16.88% | 10,522 | 1.8% |
[ 17.0% - 17.5% ] 17.33% | 13,012 | 2.7% |
[ 17.5% - 18.0% ] 17.73% | 11,318 | 4.0% |
[ 18.0% - 18.5% ] 18.08% | 7,817 | 2.5% |
[ 18.5% - 19.0% ] 18.67% | 4,194 | 4.5% |
[ 19.0% - 19.5% ] 19.20% | 14,297 | 3.3% |
[ 19.5% - 20.0% ] 19.75% | 8,465 | 4.5% |
[ 20.0% - 20.5% ] 20.29% | 12,833 | 4.1% |
[ 20.5% - 21.0% ] 20.81% | 9,708 | 4.2% |
[ 21.0% - 21.5% ] 21.28% | 7,553 | 2.4% |
[ 21.5% - 22.0% ] 21.65% | 194 | 3.3% |
[ 22.0% - 22.5% ] 22.27% | 7,984 | 5.0% |
[ 22.5% - 23.0% ] 22.80% | 3,461 | 3.0% |
[ 23.0% - 23.5% ] 23.14% | 2,057 | 3.9% |
[ 23.5% - 24.0% ] 23.82% | 10,476 | 2.9% |
[ 24.0% - 24.5% ] 24.31% | 2,468 | 1.6% |
[ 24.5% - 25.0% ] 24.70% | 19,575 | 2.6% |
[ 25.0% - 25.5% ] 25.25% | 5,121 | 4.1% |
[ 25.5% - 26.0% ] 25.70% | 2,673 | 3.3% |
[ 26.0% - 26.5% ] 26.16% | 2,401 | 1.4% |
[ 26.5% - 27.0% ] 26.64% | 9,805 | 1.1% |
[ 27.0% - 27.5% ] 27.26% | 2,781 | 3.4% |
[ 27.5% - 28.0% ] 27.64% | 2,713 | 2.0% |
[ 28.0% - 28.5% ] 28.08% | 527 | 2.8% |
[ 28.5% - 29.0% ] 28.76% | 3,477 | 2.4% |
[ 29.0% - 29.5% ] 29.03% | 2,349 | 1.0% |
[ 29.5% - 30.0% ] 29.83% | 10,680 | 2.3% |
[ 30.5% - 31.0% ] 30.59% | 706 | 2.6% |
[ 31.0% - 31.5% ] 31.34% | 552 | 1.9% |
[ 32.5% - 33.0% ] 32.76% | 7,838 | 1.5% |
[ 33.0% - 33.5% ] 33.11% | 1,063 | 2.2% |
[ 34.0% - 34.5% ] 34.27% | 356 | 5.1% |
[ 34.5% - 35.0% ] 34.54% | 194 | 6.0% |
[ 35.0% - 35.5% ] 35.39% | 1,003 | 1.1% |
[ 35.5% - 36.0% ] 35.51% | 780 | 0.84% |
[ 36.5% - 37.0% ] 36.90% | 393 | 4.8% |
[ 37.0% - 37.5% ] 37.40% | 1,179 | 3.0% |
[ 37.5% - 38.0% ] 37.61% | 117 | 5.2% |
[ 38.0% - 38.5% ] 38.28% | 1,382 | 2.4% |
[ 38.5% - 39.0% ] 38.51% | 509 | 4.2% |
[ 39.5% - 40.0% ] 39.60% | 942 | 4.6% |
[ 40.5% - 41.0% ] 40.86% | 257 | 3.1% |
[ 41.0% - 41.5% ] 41.47% | 516 | 0.60% |
[ 42.0% - 42.5% ] 42.40% | 1,198 | 3.4% |
[ 43.0% - 43.5% ] 43.49% | 499 | 5.8% |
[ 43.5% - 44.0% ] 43.78% | 201 | 4.4% |
[ 44.5% - 45.0% ] 44.95% | 109 | 3.7% |
[ 49.5% - 50.0% ] 49.75% | 396 | 6.7% |
[ 51.5% - 52.0% ] 51.65% | 273 | 2.9% |
[ 52.5% - 53.0% ] 52.80% | 2,072 | 1.2% |
[ 56.5% - 57.0% ] 56.59% | 129 | 6.6% |
[ 57.0% - 57.5% ] 57.04% | 277 | 5.9% |
[ 58.5% - 59.0% ] 58.88% | 107 | 9.2% |
[ 60.0% - 60.5% ] 60.15% | 133 | 5.2% |
[ 74.0% - 74.5% ] 74.07% | 27 | 3.7% |