Korean Self-Care Disability
COMPARE
Korean
Select to Compare
Self-Care Disability
Korean Self-Care Disability
2.5%
SELF-CARE DISABILITY
15.5/ 100
METRIC RATING
196th/ 347
METRIC RANK
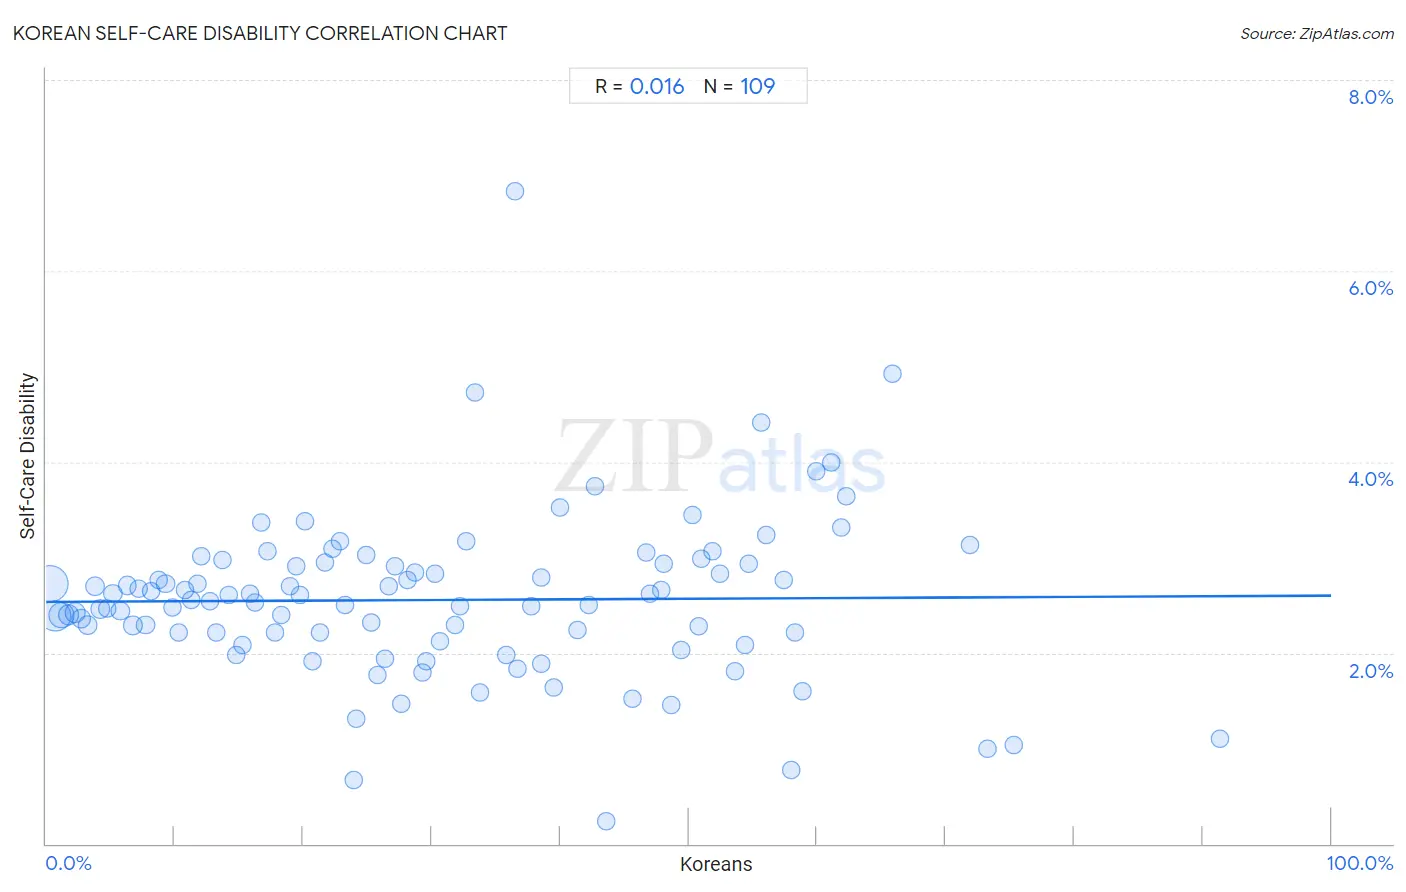
Korean Self-Care Disability Correlation Chart
The statistical analysis conducted on geographies consisting of 509,747,952 people shows no correlation between the proportion of Koreans and percentage of population with self-care disability in the United States with a correlation coefficient (R) of 0.016 and weighted average of 2.5%. On average, for every 1% (one percent) increase in Koreans within a typical geography, there is an increase of 0.00066% in percentage of population with self-care disability.
It is essential to understand that the correlation between the percentage of Koreans and percentage of population with self-care disability does not imply a direct cause-and-effect relationship. It remains uncertain whether the presence of Koreans influences an upward or downward trend in the level of percentage of population with self-care disability within an area, or if Koreans simply ended up residing in those areas with higher or lower levels of percentage of population with self-care disability due to other factors.
Demographics Similar to Koreans by Self-Care Disability
In terms of self-care disability, the demographic groups most similar to Koreans are Immigrants from Southern Europe (2.5%, a difference of 0.010%), Crow (2.5%, a difference of 0.030%), Immigrants (2.5%, a difference of 0.050%), Immigrants from Ghana (2.5%, a difference of 0.070%), and Immigrants from Germany (2.5%, a difference of 0.20%).
| Demographics | Rating | Rank | Self-Care Disability |
| Immigrants from Eastern Europe | 28.0 /100 | #189 | Fair 2.5% |
| Sioux | 24.6 /100 | #190 | Fair 2.5% |
| Moroccans | 22.9 /100 | #191 | Fair 2.5% |
| Soviet Union | 22.2 /100 | #192 | Fair 2.5% |
| Ukrainians | 21.4 /100 | #193 | Fair 2.5% |
| Immigrants from Germany | 17.9 /100 | #194 | Poor 2.5% |
| Immigrants from Southern Europe | 15.6 /100 | #195 | Poor 2.5% |
| Koreans | 15.5 /100 | #196 | Poor 2.5% |
| Crow | 15.2 /100 | #197 | Poor 2.5% |
| Immigrants | 15.0 /100 | #198 | Poor 2.5% |
| Immigrants from Ghana | 14.7 /100 | #199 | Poor 2.5% |
| Immigrants from Western Africa | 13.3 /100 | #200 | Poor 2.5% |
| Immigrants from South Eastern Asia | 12.9 /100 | #201 | Poor 2.5% |
| Slovaks | 12.6 /100 | #202 | Poor 2.5% |
| Immigrants from Lebanon | 12.4 /100 | #203 | Poor 2.5% |
Korean Self-Care Disability Correlation Summary
| Measurement | Korean Data | Self-Care Disability Data |
| Minimum | 0.26% | 0.24% |
| Maximum | 91.3% | 6.8% |
| Range | 91.1% | 6.6% |
| Mean | 30.4% | 2.6% |
| Median | 27.1% | 2.5% |
| Interquartile 25% (IQ1) | 13.4% | 2.2% |
| Interquartile 75% (IQ3) | 47.4% | 2.9% |
| Interquartile Range (IQR) | 34.0% | 0.77% |
| Standard Deviation (Sample) | 20.3% | 0.86% |
| Standard Deviation (Population) | 20.2% | 0.86% |
Correlation Details
| Korean Percentile | Sample Size | Self-Care Disability |
[ 0.0% - 0.5% ] 0.26% | 181,964,057 | 2.7% |
[ 0.5% - 1.0% ] 0.71% | 128,599,066 | 2.4% |
[ 1.0% - 1.5% ] 1.21% | 69,329,327 | 2.4% |
[ 1.5% - 2.0% ] 1.72% | 27,116,156 | 2.4% |
[ 2.0% - 2.5% ] 2.25% | 21,243,312 | 2.4% |
[ 2.5% - 3.0% ] 2.73% | 14,032,048 | 2.4% |
[ 3.0% - 3.5% ] 3.23% | 9,895,589 | 2.3% |
[ 3.5% - 4.0% ] 3.78% | 11,621,697 | 2.7% |
[ 4.0% - 4.5% ] 4.21% | 6,668,787 | 2.5% |
[ 4.5% - 5.0% ] 4.74% | 4,870,425 | 2.5% |
[ 5.0% - 5.5% ] 5.19% | 5,263,462 | 2.6% |
[ 5.5% - 6.0% ] 5.76% | 4,746,311 | 2.4% |
[ 6.0% - 6.5% ] 6.28% | 3,687,089 | 2.7% |
[ 6.5% - 7.0% ] 6.74% | 3,927,443 | 2.3% |
[ 7.0% - 7.5% ] 7.23% | 1,651,994 | 2.7% |
[ 7.5% - 8.0% ] 7.73% | 1,036,021 | 2.3% |
[ 8.0% - 8.5% ] 8.18% | 2,073,633 | 2.7% |
[ 8.5% - 9.0% ] 8.72% | 1,395,617 | 2.8% |
[ 9.0% - 9.5% ] 9.29% | 1,261,031 | 2.7% |
[ 9.5% - 10.0% ] 9.79% | 714,529 | 2.5% |
[ 10.0% - 10.5% ] 10.34% | 504,690 | 2.2% |
[ 10.5% - 11.0% ] 10.77% | 451,783 | 2.7% |
[ 11.0% - 11.5% ] 11.25% | 618,610 | 2.6% |
[ 11.5% - 12.0% ] 11.80% | 553,796 | 2.7% |
[ 12.0% - 12.5% ] 12.08% | 192,980 | 3.0% |
[ 12.5% - 13.0% ] 12.77% | 334,371 | 2.5% |
[ 13.0% - 13.5% ] 13.22% | 182,229 | 2.2% |
[ 13.5% - 14.0% ] 13.67% | 436,425 | 3.0% |
[ 14.0% - 14.5% ] 14.18% | 569,495 | 2.6% |
[ 14.5% - 15.0% ] 14.77% | 119,489 | 2.0% |
[ 15.0% - 15.5% ] 15.29% | 372,130 | 2.1% |
[ 15.5% - 16.0% ] 15.81% | 193,153 | 2.6% |
[ 16.0% - 16.5% ] 16.23% | 123,384 | 2.5% |
[ 16.5% - 17.0% ] 16.68% | 77,694 | 3.4% |
[ 17.0% - 17.5% ] 17.24% | 253,360 | 3.1% |
[ 17.5% - 18.0% ] 17.76% | 147,564 | 2.2% |
[ 18.0% - 18.5% ] 18.25% | 39,567 | 2.4% |
[ 18.5% - 19.0% ] 18.95% | 60,292 | 2.7% |
[ 19.0% - 19.5% ] 19.41% | 11,630 | 2.9% |
[ 19.5% - 20.0% ] 19.72% | 546,156 | 2.6% |
[ 20.0% - 20.5% ] 20.10% | 142,971 | 3.4% |
[ 20.5% - 21.0% ] 20.70% | 54,603 | 1.9% |
[ 21.0% - 21.5% ] 21.34% | 179,148 | 2.2% |
[ 21.5% - 22.0% ] 21.73% | 181,523 | 2.9% |
[ 22.0% - 22.5% ] 22.29% | 171,335 | 3.1% |
[ 22.5% - 23.0% ] 22.84% | 245,194 | 3.2% |
[ 23.0% - 23.5% ] 23.22% | 147,682 | 2.5% |
[ 23.5% - 24.0% ] 23.97% | 5,023 | 0.67% |
[ 24.0% - 24.5% ] 24.11% | 7,930 | 1.3% |
[ 24.5% - 25.0% ] 24.87% | 105,082 | 3.0% |
[ 25.0% - 25.5% ] 25.32% | 69,833 | 2.3% |
[ 25.5% - 26.0% ] 25.78% | 57,348 | 1.8% |
[ 26.0% - 26.5% ] 26.35% | 28,564 | 1.9% |
[ 26.5% - 27.0% ] 26.68% | 21,120 | 2.7% |
[ 27.0% - 27.5% ] 27.14% | 56,225 | 2.9% |
[ 27.5% - 28.0% ] 27.62% | 45,724 | 1.5% |
[ 28.0% - 28.5% ] 28.12% | 79,696 | 2.8% |
[ 28.5% - 29.0% ] 28.71% | 54,972 | 2.8% |
[ 29.0% - 29.5% ] 29.29% | 17,819 | 1.8% |
[ 29.5% - 30.0% ] 29.54% | 60,936 | 1.9% |
[ 30.0% - 30.5% ] 30.25% | 64,561 | 2.8% |
[ 30.5% - 31.0% ] 30.67% | 46,802 | 2.1% |
[ 31.5% - 32.0% ] 31.79% | 114,846 | 2.3% |
[ 32.0% - 32.5% ] 32.22% | 148,162 | 2.5% |
[ 32.5% - 33.0% ] 32.72% | 162,383 | 3.2% |
[ 33.0% - 33.5% ] 33.36% | 7,363 | 4.7% |
[ 33.5% - 34.0% ] 33.74% | 4,721 | 1.6% |
[ 35.5% - 36.0% ] 35.84% | 24,950 | 2.0% |
[ 36.0% - 36.5% ] 36.46% | 1,629 | 6.8% |
[ 36.5% - 37.0% ] 36.63% | 25,099 | 1.8% |
[ 37.5% - 38.0% ] 37.77% | 26,169 | 2.5% |
[ 38.0% - 38.5% ] 38.49% | 12,906 | 1.9% |
[ 38.5% - 39.0% ] 38.53% | 6,419 | 2.8% |
[ 39.0% - 39.5% ] 39.49% | 1,023 | 1.6% |
[ 39.5% - 40.0% ] 39.96% | 548 | 3.5% |
[ 41.0% - 41.5% ] 41.37% | 17,400 | 2.2% |
[ 42.0% - 42.5% ] 42.22% | 5,393 | 2.5% |
[ 42.5% - 43.0% ] 42.74% | 3,053 | 3.7% |
[ 43.5% - 44.0% ] 43.57% | 3,576 | 0.24% |
[ 45.5% - 46.0% ] 45.67% | 7,728 | 1.5% |
[ 46.5% - 47.0% ] 46.69% | 59,008 | 3.0% |
[ 47.0% - 47.5% ] 47.01% | 1,372 | 2.6% |
[ 47.5% - 48.0% ] 47.85% | 82,504 | 2.7% |
[ 48.0% - 48.5% ] 48.05% | 17,604 | 2.9% |
[ 48.5% - 49.0% ] 48.64% | 294 | 1.4% |
[ 49.0% - 49.5% ] 49.39% | 2,290 | 2.0% |
[ 50.0% - 50.5% ] 50.27% | 2,242 | 3.4% |
[ 50.5% - 51.0% ] 50.78% | 27,198 | 2.3% |
[ 51.0% - 51.5% ] 51.01% | 30,256 | 3.0% |
[ 51.5% - 52.0% ] 51.88% | 6,469 | 3.1% |
[ 52.0% - 52.5% ] 52.44% | 25,902 | 2.8% |
[ 53.5% - 54.0% ] 53.63% | 17,137 | 1.8% |
[ 54.0% - 54.5% ] 54.42% | 5,026 | 2.1% |
[ 54.5% - 55.0% ] 54.63% | 3,174 | 2.9% |
[ 55.5% - 56.0% ] 55.61% | 766 | 4.4% |
[ 56.0% - 56.5% ] 56.07% | 72,605 | 3.2% |
[ 57.0% - 57.5% ] 57.43% | 3,961 | 2.8% |
[ 57.5% - 58.0% ] 57.93% | 618 | 0.78% |
[ 58.0% - 58.5% ] 58.31% | 890 | 2.2% |
[ 58.5% - 59.0% ] 58.86% | 3,262 | 1.6% |
[ 59.5% - 60.0% ] 59.90% | 2,299 | 3.9% |
[ 61.0% - 61.5% ] 61.06% | 2,255 | 4.0% |
[ 61.5% - 62.0% ] 61.89% | 19,795 | 3.3% |
[ 62.0% - 62.5% ] 62.24% | 3,909 | 3.6% |
[ 65.5% - 66.0% ] 65.90% | 39,873 | 4.9% |
[ 71.5% - 72.0% ] 71.88% | 6,550 | 3.1% |
[ 73.0% - 73.5% ] 73.27% | 1,949 | 1.0% |
[ 75.0% - 75.5% ] 75.28% | 1,897 | 1.0% |
[ 91.0% - 91.5% ] 91.32% | 2,996 | 1.1% |