Austrian Self-Care Disability

COMPARE

Austrian
Race
Ancestry
AfghanAfricanAlaska NativeAlaskan AthabascanAlbanianAleutAlsatianAmericanApacheArabArapahoArgentineanArmenianAssyrian/Chaldean/SyriacAustralianAustrianBahamianBangladeshiBarbadianBasqueBelgianBelizeanBermudanBhutaneseBlackfeetBolivianBrazilianBritishBritish West IndianBulgarianBurmeseCajunCambodianCanadianCape VerdeanCarpatho RusynCelticCentral AmericanCentral American IndianCherokeeCheyenneChickasawChileanChineseChippewaChoctawColombianColvilleComancheCosta RicanCreeCreekCroatianCrowCubanCypriotCzechCzechoslovakianDanishDelawareDominicanDutchDutch West IndianEastern EuropeanEcuadorianEgyptianEnglishEstonianEthiopianEuropeanFijianFilipinoFinnishFrenchFrench American IndianFrench CanadianGermanGerman RussianGhanaianGreekGuamanian/ChamorroGuatemalanGuyaneseHaitianHmongHonduranHopiHoumaHungarianIcelanderIndian (Asian)IndonesianInupiatIranianIraqiIrishIroquoisIsraeliItalianJamaicanJapaneseJordanianKenyanKiowaKoreanLaotianLatvianLebaneseLiberianLithuanianLumbeeLuxembourgerMacedonianMalaysianMalteseMarshalleseMenomineeMexicanMexican American IndianMongolianMoroccanNative HawaiianNavajoNepaleseNew ZealanderNicaraguanNigerianNorthern EuropeanNorwegianOkinawanOsageOttawaPaiutePakistaniPalestinianPanamanianParaguayanPennsylvania GermanPeruvianPimaPolishPortuguesePotawatomiPuebloPuerto RicanPuget Sound SalishRomanianRussianSalvadoranSamoanScandinavianScotch-IrishScottishSeminoleSenegaleseSerbianShoshoneSierra LeoneanSiouxSlavicSlovakSloveneSomaliSouth AfricanSouth AmericanSouth American IndianSoviet UnionSpaniardSpanishSpanish AmericanSpanish American IndianSri LankanSubsaharan AfricanSudaneseSwedishSwissSyrianTaiwaneseThaiTlingit-HaidaTohono O'OdhamTonganTrinidadian and TobagonianTsimshianTurkishU.S. Virgin IslanderUgandanUkrainianUruguayanUteVenezuelanVietnameseWelshWest IndianYakamaYaquiYugoslavianYumanYup'ikZimbabwean
Immigration
NonimmigrantsImmigrantsAfghanistanAfricaAlbaniaArgentinaArmeniaAsiaAustraliaAustriaBahamasBangladeshBarbadosBelarusBelgiumBelizeBoliviaBosnia and HerzegovinaBrazilBulgariaBurma/MyanmarCabo VerdeCambodiaCameroonCanadaCaribbeanCentral AmericaChileChinaColombiaCongoCosta RicaCroatiaCubaCzechoslovakiaDenmarkDominicaDominican RepublicEastern AfricaEastern AsiaEastern EuropeEcuadorEgyptEl SalvadorEnglandEritreaEthiopiaEuropeFijiFranceGermanyGhanaGreeceGrenadaGuatemalaGuyanaHaitiHondurasHong KongHungaryIndiaIndonesiaIranIraqIrelandIsraelItalyJamaicaJapanJordanKazakhstanKenyaKoreaKuwaitLaosLatin AmericaLatviaLebanonLiberiaLithuaniaMalaysiaMexicoMicronesiaMiddle AfricaMoldovaMoroccoNepalNetherlandsNicaraguaNigeriaNorth AmericaNorth MacedoniaNorthern AfricaNorthern EuropeNorwayOceaniaPakistanPanamaPeruPhilippinesPolandPortugalRomaniaRussiaSaudi ArabiaScotlandSenegalSerbiaSierra LeoneSingaporeSomaliaSouth AfricaSouth AmericaSouth Central AsiaSouth Eastern AsiaSouthern EuropeSpainSri LankaSt. Vincent and the GrenadinesSudanSwedenSwitzerlandSyriaTaiwanThailandTrinidad and TobagoTurkeyUgandaUkraineUruguayUzbekistanVenezuelaVietnamWest IndiesWestern AfricaWestern AsiaWestern EuropeYemenZaireZimbabweAzores
Select to Compare
Race
Ancestry
AfghanAfricanAlaska NativeAlaskan AthabascanAlbanianAleutAlsatianAmericanApacheArabArapahoArgentineanArmenianAssyrian/Chaldean/SyriacAustralianBahamianBangladeshiBarbadianBasqueBelgianBelizeanBermudanBhutaneseBlackfeetBolivianBrazilianBritishBritish West IndianBulgarianBurmeseCajunCambodianCanadianCape VerdeanCarpatho RusynCelticCentral AmericanCentral American IndianCherokeeCheyenneChickasawChileanChineseChippewaChoctawColombianColvilleComancheCosta RicanCreeCreekCroatianCrowCubanCypriotCzechCzechoslovakianDanishDelawareDominicanDutchDutch West IndianEastern EuropeanEcuadorianEgyptianEnglishEstonianEthiopianEuropeanFijianFilipinoFinnishFrenchFrench American IndianFrench CanadianGermanGerman RussianGhanaianGreekGuamanian/ChamorroGuatemalanGuyaneseHaitianHmongHonduranHopiHoumaHungarianIcelanderIndian (Asian)IndonesianInupiatIranianIraqiIrishIroquoisIsraeliItalianJamaicanJapaneseJordanianKenyanKiowaKoreanLaotianLatvianLebaneseLiberianLithuanianLumbeeLuxembourgerMacedonianMalaysianMalteseMarshalleseMenomineeMexicanMexican American IndianMongolianMoroccanNative HawaiianNavajoNepaleseNew ZealanderNicaraguanNigerianNorthern EuropeanNorwegianOkinawanOsageOttawaPaiutePakistaniPalestinianPanamanianParaguayanPennsylvania GermanPeruvianPimaPolishPortuguesePotawatomiPuebloPuerto RicanPuget Sound SalishRomanianRussianSalvadoranSamoanScandinavianScotch-IrishScottishSeminoleSenegaleseSerbianShoshoneSierra LeoneanSiouxSlavicSlovakSloveneSomaliSouth AfricanSouth AmericanSouth American IndianSoviet UnionSpaniardSpanishSpanish AmericanSpanish American IndianSri LankanSubsaharan AfricanSudaneseSwedishSwissSyrianTaiwaneseThaiTlingit-HaidaTohono O'OdhamTonganTrinidadian and TobagonianTsimshianTurkishU.S. Virgin IslanderUgandanUkrainianUruguayanUteVenezuelanVietnameseWelshWest IndianYakamaYaquiYugoslavianYumanYup'ikZimbabwean
Immigration
NonimmigrantsImmigrantsAfghanistanAfricaAlbaniaArgentinaArmeniaAsiaAustraliaAustriaBahamasBangladeshBarbadosBelarusBelgiumBelizeBoliviaBosnia and HerzegovinaBrazilBulgariaBurma/MyanmarCabo VerdeCambodiaCameroonCanadaCaribbeanCentral AmericaChileChinaColombiaCongoCosta RicaCroatiaCubaCzechoslovakiaDenmarkDominicaDominican RepublicEastern AfricaEastern AsiaEastern EuropeEcuadorEgyptEl SalvadorEnglandEritreaEthiopiaEuropeFijiFranceGermanyGhanaGreeceGrenadaGuatemalaGuyanaHaitiHondurasHong KongHungaryIndiaIndonesiaIranIraqIrelandIsraelItalyJamaicaJapanJordanKazakhstanKenyaKoreaKuwaitLaosLatin AmericaLatviaLebanonLiberiaLithuaniaMalaysiaMexicoMicronesiaMiddle AfricaMoldovaMoroccoNepalNetherlandsNicaraguaNigeriaNorth AmericaNorth MacedoniaNorthern AfricaNorthern EuropeNorwayOceaniaPakistanPanamaPeruPhilippinesPolandPortugalRomaniaRussiaSaudi ArabiaScotlandSenegalSerbiaSierra LeoneSingaporeSomaliaSouth AfricaSouth AmericaSouth Central AsiaSouth Eastern AsiaSouthern EuropeSpainSri LankaSt. Vincent and the GrenadinesSudanSwedenSwitzerlandSyriaTaiwanThailandTrinidad and TobagoTurkeyUgandaUkraineUruguayUzbekistanVenezuelaVietnamWest IndiesWestern AfricaWestern AsiaWestern EuropeYemenZaireZimbabweAzores
Self-Care Disability
Income
Poverty
Unemployment
Labor Participation
Family Structure
Vehicle Availability
Education Level
Disability

Austrian Self-Care Disability
Excellent

2.4%
SELF-CARE DISABILITY
87.0/ 100
METRIC RATING
137th/ 347
METRIC RANK

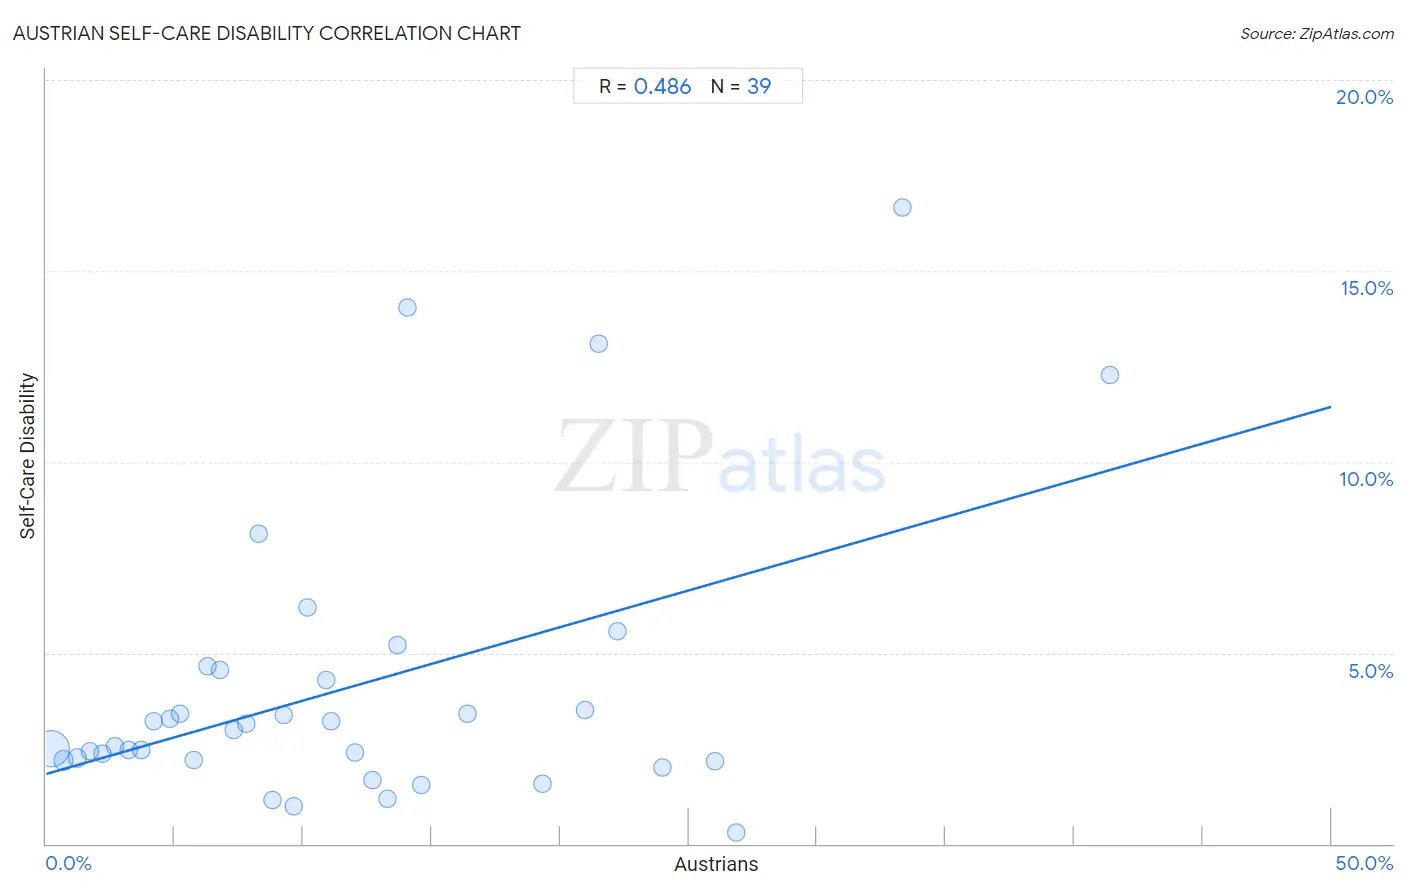
Austrian Self-Care Disability Correlation Chart

The statistical analysis conducted on geographies consisting of 451,319,038 people shows a moderate positive correlation between the proportion of Austrians and percentage of population with self-care disability in the United States with a correlation coefficient (R) of 0.486 and weighted average of 2.4%. On average, for every 1% (one percent) increase in Austrians within a typical geography, there is an increase of 0.19% in percentage of population with self-care disability.
Austrian Self-Care Disability
It is essential to understand that the correlation between the percentage of Austrians and percentage of population with self-care disability does not imply a direct cause-and-effect relationship. It remains uncertain whether the presence of Austrians influences an upward or downward trend in the level of percentage of population with self-care disability within an area, or if Austrians simply ended up residing in those areas with higher or lower levels of percentage of population with self-care disability due to other factors.

Demographics Similar to Austrians by Self-Care Disability

In terms of self-care disability, the demographic groups most similar to Austrians are South American Indian (2.4%, a difference of 0.020%), Immigrants from Croatia (2.4%, a difference of 0.050%), Sri Lankan (2.4%, a difference of 0.050%), Laotian (2.4%, a difference of 0.080%), and Russian (2.4%, a difference of 0.14%).
DemographicsRating | RankSelf-Care Disability
Immigrants from Austria
89.0
/100
|
#130
Excellent
2.4%
Poles
88.9
/100
|
#131
Excellent
2.4%
Immigrants from South America
88.8
/100
|
#132
Excellent
2.4%
Immigrants from Colombia
88.5
/100
|
#133
Excellent
2.4%
Russians
88.2
/100
|
#134
Excellent
2.4%
Laotians
87.8
/100
|
#135
Excellent
2.4%
South American Indians
87.2
/100
|
#136
Excellent
2.4%
Austrians
87.0
/100
|
#137
Excellent
2.4%
Immigrants from Croatia
86.6
/100
|
#138
Excellent
2.4%
Sri Lankans
86.6
/100
|
#139
Excellent
2.4%
Immigrants from Uruguay
85.4
/100
|
#140
Excellent
2.4%
Alaska Natives
84.5
/100
|
#141
Excellent
2.4%
Immigrants from Peru
83.2
/100
|
#142
Excellent
2.4%
Afghans
82.3
/100
|
#143
Excellent
2.4%
Costa Ricans
80.8
/100
|
#144
Excellent
2.4%

Austrian Self-Care Disability Correlation Summary

MeasurementAustrian DataSelf-Care Disability Data
Minimum0.17%0.31%
Maximum41.4%16.7%
Range41.2%16.4%
Mean11.9%4.1%
Median9.6%3.0%
Interquartile 25% (IQ1)4.8%2.2%
Interquartile 75% (IQ3)16.4%4.6%
Interquartile Range (IQR)11.6%2.4%
Standard Deviation (Sample)9.5%3.7%
Standard Deviation (Population)9.3%3.7%

Correlation Details

Austrian PercentileSample SizeSelf-Care Disability
[
0.0%
-
0.5%
]
0.17%
406,179,9862.5%
[
0.5%
-
1.0%
]
0.67%
36,399,6222.2%
[
1.0%
-
1.5%
]
1.20%
6,088,2132.2%
[
1.5%
-
2.0%
]
1.70%
1,550,4442.4%
[
2.0%
-
2.5%
]
2.20%
444,1652.4%
[
2.5%
-
3.0%
]
2.70%
254,0112.6%
[
3.0%
-
3.5%
]
3.19%
119,2722.5%
[
3.5%
-
4.0%
]
3.71%
102,2612.5%
[
4.0%
-
4.5%
]
4.19%
63,4623.2%
[
4.5%
-
5.0%
]
4.80%
26,4343.3%
[
5.0%
-
5.5%
]
5.20%
15,5093.4%
[
5.5%
-
6.0%
]
5.76%
11,3842.2%
[
6.0%
-
6.5%
]
6.27%
12,3354.6%
[
6.5%
-
7.0%
]
6.75%
6,4874.6%
[
7.0%
-
7.5%
]
7.30%
9,3333.0%
[
7.5%
-
8.0%
]
7.79%
7,0073.2%
[
8.0%
-
8.5%
]
8.29%
1,0138.1%
[
8.5%
-
9.0%
]
8.80%
2,7401.1%
[
9.0%
-
9.5%
]
9.25%
1,4383.4%
[
9.5%
-
10.0%
]
9.61%
3,7580.99%
[
10.0%
-
10.5%
]
10.18%
3,4006.2%
[
10.5%
-
11.0%
]
10.89%
3,7654.3%
[
11.0%
-
11.5%
]
11.09%
5953.2%
[
12.0%
-
12.5%
]
12.04%
4572.4%
[
12.5%
-
13.0%
]
12.68%
5,9931.7%
[
13.0%
-
13.5%
]
13.26%
3771.2%
[
13.5%
-
14.0%
]
13.68%
1175.2%
[
14.0%
-
14.5%
]
14.06%
31314.1%
[
14.5%
-
15.0%
]
14.62%
1301.6%
[
16.0%
-
16.5%
]
16.41%
2,3953.4%
[
19.0%
-
19.5%
]
19.31%
3781.6%
[
20.5%
-
21.0%
]
20.97%
3723.5%
[
21.0%
-
21.5%
]
21.50%
10713.1%
[
22.0%
-
22.5%
]
22.22%
725.6%
[
23.5%
-
24.0%
]
23.95%
5262.0%
[
26.0%
-
26.5%
]
26.04%
1922.2%
[
26.5%
-
27.0%
]
26.84%
6520.31%
[
33.0%
-
33.5%
]
33.33%
10816.7%
[
41.0%
-
41.5%
]
41.40%
21512.3%