Scotch-Irish Ambulatory Disability
COMPARE
Scotch-Irish
Select to Compare
Ambulatory Disability
Scotch-Irish Ambulatory Disability
6.9%
AMBULATORY DISABILITY
0.0/ 100
METRIC RATING
290th/ 347
METRIC RANK
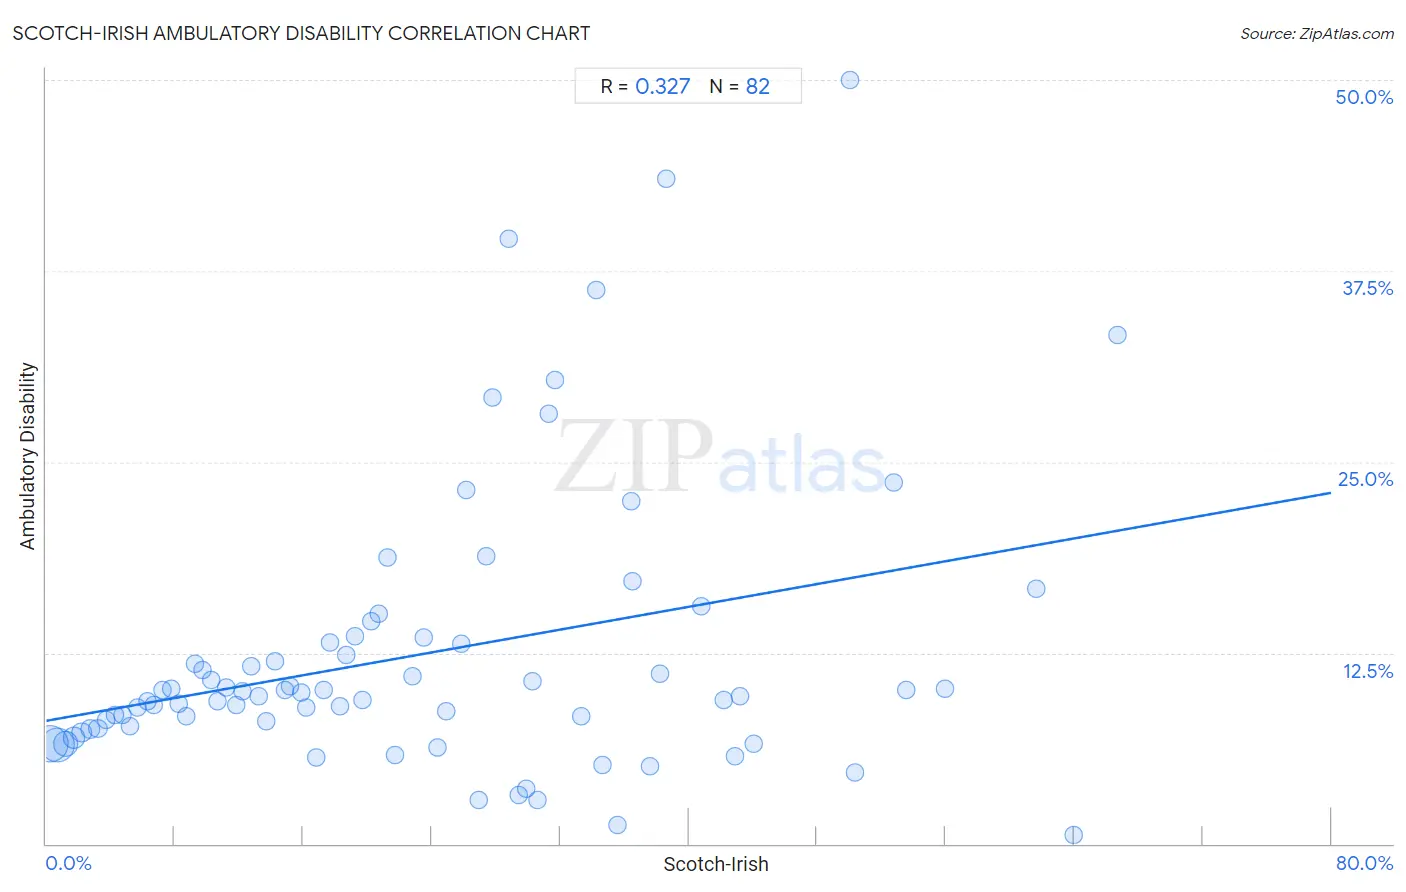
Scotch-Irish Ambulatory Disability Correlation Chart
The statistical analysis conducted on geographies consisting of 548,439,452 people shows a mild positive correlation between the proportion of Scotch-Irish and percentage of population with ambulatory disability in the United States with a correlation coefficient (R) of 0.327 and weighted average of 6.9%. On average, for every 1% (one percent) increase in Scotch-Irish within a typical geography, there is an increase of 0.19% in percentage of population with ambulatory disability.
It is essential to understand that the correlation between the percentage of Scotch-Irish and percentage of population with ambulatory disability does not imply a direct cause-and-effect relationship. It remains uncertain whether the presence of Scotch-Irish influences an upward or downward trend in the level of percentage of population with ambulatory disability within an area, or if Scotch-Irish simply ended up residing in those areas with higher or lower levels of percentage of population with ambulatory disability due to other factors.
Demographics Similar to Scotch-Irish by Ambulatory Disability
In terms of ambulatory disability, the demographic groups most similar to Scotch-Irish are Immigrants from Dominica (6.9%, a difference of 0.030%), West Indian (6.9%, a difference of 0.10%), Cheyenne (6.9%, a difference of 0.16%), Nonimmigrants (6.9%, a difference of 0.17%), and Immigrants from St. Vincent and the Grenadines (6.9%, a difference of 0.40%).
| Demographics | Rating | Rank | Ambulatory Disability |
| Immigrants from Barbados | 0.0 /100 | #283 | Tragic 6.8% |
| Immigrants from Jamaica | 0.0 /100 | #284 | Tragic 6.8% |
| Fijians | 0.0 /100 | #285 | Tragic 6.8% |
| Yakama | 0.0 /100 | #286 | Tragic 6.8% |
| U.S. Virgin Islanders | 0.0 /100 | #287 | Tragic 6.8% |
| Nonimmigrants | 0.0 /100 | #288 | Tragic 6.9% |
| Immigrants from Dominica | 0.0 /100 | #289 | Tragic 6.9% |
| Scotch-Irish | 0.0 /100 | #290 | Tragic 6.9% |
| West Indians | 0.0 /100 | #291 | Tragic 6.9% |
| Cheyenne | 0.0 /100 | #292 | Tragic 6.9% |
| Immigrants from St. Vincent and the Grenadines | 0.0 /100 | #293 | Tragic 6.9% |
| Cape Verdeans | 0.0 /100 | #294 | Tragic 6.9% |
| Crow | 0.0 /100 | #295 | Tragic 6.9% |
| Alaskan Athabascans | 0.0 /100 | #296 | Tragic 6.9% |
| French American Indians | 0.0 /100 | #297 | Tragic 6.9% |
Scotch-Irish Ambulatory Disability Correlation Summary
| Measurement | Scotch-Irish Data | Ambulatory Disability Data |
| Minimum | 0.25% | 0.57% |
| Maximum | 66.7% | 50.0% |
| Range | 66.4% | 49.4% |
| Mean | 23.4% | 12.4% |
| Median | 20.5% | 9.8% |
| Interquartile 25% (IQ1) | 10.3% | 7.5% |
| Interquartile 75% (IQ3) | 34.3% | 13.2% |
| Interquartile Range (IQR) | 24.0% | 5.6% |
| Standard Deviation (Sample) | 16.3% | 9.3% |
| Standard Deviation (Population) | 16.2% | 9.2% |
Correlation Details
| Scotch-Irish Percentile | Sample Size | Ambulatory Disability |
[ 0.0% - 0.5% ] 0.25% | 210,707,018 | 6.5% |
[ 0.5% - 1.0% ] 0.72% | 183,212,097 | 6.4% |
[ 1.0% - 1.5% ] 1.21% | 82,695,572 | 6.6% |
[ 1.5% - 2.0% ] 1.72% | 36,462,177 | 6.9% |
[ 2.0% - 2.5% ] 2.21% | 15,890,129 | 7.3% |
[ 2.5% - 3.0% ] 2.73% | 7,863,957 | 7.5% |
[ 3.0% - 3.5% ] 3.23% | 5,129,369 | 7.5% |
[ 3.5% - 4.0% ] 3.75% | 2,456,218 | 8.1% |
[ 4.0% - 4.5% ] 4.25% | 1,275,902 | 8.4% |
[ 4.5% - 5.0% ] 4.76% | 746,881 | 8.4% |
[ 5.0% - 5.5% ] 5.23% | 641,837 | 7.7% |
[ 5.5% - 6.0% ] 5.71% | 322,813 | 8.9% |
[ 6.0% - 6.5% ] 6.29% | 209,191 | 9.3% |
[ 6.5% - 7.0% ] 6.71% | 139,350 | 9.1% |
[ 7.0% - 7.5% ] 7.24% | 120,307 | 10.1% |
[ 7.5% - 8.0% ] 7.79% | 111,597 | 10.1% |
[ 8.0% - 8.5% ] 8.22% | 75,267 | 9.2% |
[ 8.5% - 9.0% ] 8.75% | 60,608 | 8.4% |
[ 9.0% - 9.5% ] 9.25% | 40,363 | 11.8% |
[ 9.5% - 10.0% ] 9.75% | 37,211 | 11.3% |
[ 10.0% - 10.5% ] 10.28% | 36,183 | 10.8% |
[ 10.5% - 11.0% ] 10.70% | 25,496 | 9.3% |
[ 11.0% - 11.5% ] 11.24% | 19,949 | 10.2% |
[ 11.5% - 12.0% ] 11.80% | 17,334 | 9.1% |
[ 12.0% - 12.5% ] 12.23% | 8,979 | 10.0% |
[ 12.5% - 13.0% ] 12.75% | 5,049 | 11.6% |
[ 13.0% - 13.5% ] 13.22% | 19,012 | 9.6% |
[ 13.5% - 14.0% ] 13.70% | 16,485 | 8.0% |
[ 14.0% - 14.5% ] 14.26% | 15,787 | 11.9% |
[ 14.5% - 15.0% ] 14.85% | 3,225 | 10.1% |
[ 15.0% - 15.5% ] 15.17% | 6,541 | 10.3% |
[ 15.5% - 16.0% ] 15.86% | 4,696 | 9.9% |
[ 16.0% - 16.5% ] 16.22% | 10,372 | 8.9% |
[ 16.5% - 17.0% ] 16.81% | 4,776 | 5.7% |
[ 17.0% - 17.5% ] 17.25% | 7,791 | 10.0% |
[ 17.5% - 18.0% ] 17.66% | 9,586 | 13.2% |
[ 18.0% - 18.5% ] 18.30% | 2,180 | 9.0% |
[ 18.5% - 19.0% ] 18.65% | 2,917 | 12.4% |
[ 19.0% - 19.5% ] 19.22% | 1,868 | 13.5% |
[ 19.5% - 20.0% ] 19.72% | 1,009 | 9.4% |
[ 20.0% - 20.5% ] 20.26% | 770 | 14.6% |
[ 20.5% - 21.0% ] 20.72% | 2,760 | 15.1% |
[ 21.0% - 21.5% ] 21.23% | 1,234 | 18.7% |
[ 21.5% - 22.0% ] 21.71% | 1,773 | 5.8% |
[ 22.5% - 23.0% ] 22.77% | 1,458 | 10.9% |
[ 23.0% - 23.5% ] 23.48% | 903 | 13.5% |
[ 24.0% - 24.5% ] 24.34% | 226 | 6.3% |
[ 24.5% - 25.0% ] 24.87% | 1,717 | 8.6% |
[ 25.5% - 26.0% ] 25.83% | 724 | 13.1% |
[ 26.0% - 26.5% ] 26.17% | 405 | 23.2% |
[ 26.5% - 27.0% ] 26.92% | 364 | 2.8% |
[ 27.0% - 27.5% ] 27.43% | 175 | 18.9% |
[ 27.5% - 28.0% ] 27.78% | 144 | 29.3% |
[ 28.5% - 29.0% ] 28.81% | 361 | 39.6% |
[ 29.0% - 29.5% ] 29.42% | 469 | 3.2% |
[ 29.5% - 30.0% ] 29.91% | 662 | 3.6% |
[ 30.0% - 30.5% ] 30.26% | 3,024 | 10.6% |
[ 30.5% - 31.0% ] 30.57% | 386 | 2.8% |
[ 31.0% - 31.5% ] 31.25% | 32 | 28.1% |
[ 31.5% - 32.0% ] 31.65% | 79 | 30.4% |
[ 33.0% - 33.5% ] 33.33% | 36 | 8.3% |
[ 34.0% - 34.5% ] 34.26% | 683 | 36.2% |
[ 34.5% - 35.0% ] 34.62% | 234 | 5.1% |
[ 35.5% - 36.0% ] 35.54% | 166 | 1.2% |
[ 36.0% - 36.5% ] 36.40% | 728 | 22.5% |
[ 36.5% - 37.0% ] 36.53% | 605 | 17.2% |
[ 37.5% - 38.0% ] 37.58% | 157 | 5.0% |
[ 38.0% - 38.5% ] 38.18% | 55 | 11.1% |
[ 38.5% - 39.0% ] 38.61% | 101 | 43.6% |
[ 40.5% - 41.0% ] 40.78% | 103 | 15.5% |
[ 42.0% - 42.5% ] 42.19% | 64 | 9.4% |
[ 42.5% - 43.0% ] 42.86% | 35 | 5.7% |
[ 43.0% - 43.5% ] 43.17% | 556 | 9.7% |
[ 44.0% - 44.5% ] 44.08% | 338 | 6.5% |
[ 50.0% - 50.5% ] 50.00% | 26 | 50.0% |
[ 50.0% - 50.5% ] 50.34% | 149 | 4.7% |
[ 52.5% - 53.0% ] 52.73% | 55 | 23.6% |
[ 53.5% - 54.0% ] 53.51% | 299 | 10.0% |
[ 55.5% - 56.0% ] 55.93% | 59 | 10.2% |
[ 61.5% - 62.0% ] 61.67% | 60 | 16.7% |
[ 64.0% - 64.5% ] 64.00% | 175 | 0.57% |
[ 66.5% - 67.0% ] 66.67% | 3 | 33.3% |