Bahamian Self-Care Disability

COMPARE

Bahamian
Race
Ancestry
AfghanAfricanAlaska NativeAlaskan AthabascanAlbanianAleutAlsatianAmericanApacheArabArapahoArgentineanArmenianAssyrian/Chaldean/SyriacAustralianAustrianBahamianBangladeshiBarbadianBasqueBelgianBelizeanBermudanBhutaneseBlackfeetBolivianBrazilianBritishBritish West IndianBulgarianBurmeseCajunCambodianCanadianCape VerdeanCarpatho RusynCelticCentral AmericanCentral American IndianCherokeeCheyenneChickasawChileanChineseChippewaChoctawColombianColvilleComancheCosta RicanCreeCreekCroatianCrowCubanCypriotCzechCzechoslovakianDanishDelawareDominicanDutchDutch West IndianEastern EuropeanEcuadorianEgyptianEnglishEstonianEthiopianEuropeanFijianFilipinoFinnishFrenchFrench American IndianFrench CanadianGermanGerman RussianGhanaianGreekGuamanian/ChamorroGuatemalanGuyaneseHaitianHmongHonduranHopiHoumaHungarianIcelanderIndian (Asian)IndonesianInupiatIranianIraqiIrishIroquoisIsraeliItalianJamaicanJapaneseJordanianKenyanKiowaKoreanLaotianLatvianLebaneseLiberianLithuanianLumbeeLuxembourgerMacedonianMalaysianMalteseMarshalleseMenomineeMexicanMexican American IndianMongolianMoroccanNative HawaiianNavajoNepaleseNew ZealanderNicaraguanNigerianNorthern EuropeanNorwegianOkinawanOsageOttawaPaiutePakistaniPalestinianPanamanianParaguayanPennsylvania GermanPeruvianPimaPolishPortuguesePotawatomiPuebloPuerto RicanPuget Sound SalishRomanianRussianSalvadoranSamoanScandinavianScotch-IrishScottishSeminoleSenegaleseSerbianShoshoneSierra LeoneanSiouxSlavicSlovakSloveneSomaliSouth AfricanSouth AmericanSouth American IndianSoviet UnionSpaniardSpanishSpanish AmericanSpanish American IndianSri LankanSubsaharan AfricanSudaneseSwedishSwissSyrianTaiwaneseThaiTlingit-HaidaTohono O'OdhamTonganTrinidadian and TobagonianTsimshianTurkishU.S. Virgin IslanderUgandanUkrainianUruguayanUteVenezuelanVietnameseWelshWest IndianYakamaYaquiYugoslavianYumanYup'ikZimbabwean
Immigration
NonimmigrantsImmigrantsAfghanistanAfricaAlbaniaArgentinaArmeniaAsiaAustraliaAustriaBahamasBangladeshBarbadosBelarusBelgiumBelizeBoliviaBosnia and HerzegovinaBrazilBulgariaBurma/MyanmarCabo VerdeCambodiaCameroonCanadaCaribbeanCentral AmericaChileChinaColombiaCongoCosta RicaCroatiaCubaCzechoslovakiaDenmarkDominicaDominican RepublicEastern AfricaEastern AsiaEastern EuropeEcuadorEgyptEl SalvadorEnglandEritreaEthiopiaEuropeFijiFranceGermanyGhanaGreeceGrenadaGuatemalaGuyanaHaitiHondurasHong KongHungaryIndiaIndonesiaIranIraqIrelandIsraelItalyJamaicaJapanJordanKazakhstanKenyaKoreaKuwaitLaosLatin AmericaLatviaLebanonLiberiaLithuaniaMalaysiaMexicoMicronesiaMiddle AfricaMoldovaMoroccoNepalNetherlandsNicaraguaNigeriaNorth AmericaNorth MacedoniaNorthern AfricaNorthern EuropeNorwayOceaniaPakistanPanamaPeruPhilippinesPolandPortugalRomaniaRussiaSaudi ArabiaScotlandSenegalSerbiaSierra LeoneSingaporeSomaliaSouth AfricaSouth AmericaSouth Central AsiaSouth Eastern AsiaSouthern EuropeSpainSri LankaSt. Vincent and the GrenadinesSudanSwedenSwitzerlandSyriaTaiwanThailandTrinidad and TobagoTurkeyUgandaUkraineUruguayUzbekistanVenezuelaVietnamWest IndiesWestern AfricaWestern AsiaWestern EuropeYemenZaireZimbabweAzores
Select to Compare
Race
Ancestry
AfghanAfricanAlaska NativeAlaskan AthabascanAlbanianAleutAlsatianAmericanApacheArabArapahoArgentineanArmenianAssyrian/Chaldean/SyriacAustralianAustrianBangladeshiBarbadianBasqueBelgianBelizeanBermudanBhutaneseBlackfeetBolivianBrazilianBritishBritish West IndianBulgarianBurmeseCajunCambodianCanadianCape VerdeanCarpatho RusynCelticCentral AmericanCentral American IndianCherokeeCheyenneChickasawChileanChineseChippewaChoctawColombianColvilleComancheCosta RicanCreeCreekCroatianCrowCubanCypriotCzechCzechoslovakianDanishDelawareDominicanDutchDutch West IndianEastern EuropeanEcuadorianEgyptianEnglishEstonianEthiopianEuropeanFijianFilipinoFinnishFrenchFrench American IndianFrench CanadianGermanGerman RussianGhanaianGreekGuamanian/ChamorroGuatemalanGuyaneseHaitianHmongHonduranHopiHoumaHungarianIcelanderIndian (Asian)IndonesianInupiatIranianIraqiIrishIroquoisIsraeliItalianJamaicanJapaneseJordanianKenyanKiowaKoreanLaotianLatvianLebaneseLiberianLithuanianLumbeeLuxembourgerMacedonianMalaysianMalteseMarshalleseMenomineeMexicanMexican American IndianMongolianMoroccanNative HawaiianNavajoNepaleseNew ZealanderNicaraguanNigerianNorthern EuropeanNorwegianOkinawanOsageOttawaPaiutePakistaniPalestinianPanamanianParaguayanPennsylvania GermanPeruvianPimaPolishPortuguesePotawatomiPuebloPuerto RicanPuget Sound SalishRomanianRussianSalvadoranSamoanScandinavianScotch-IrishScottishSeminoleSenegaleseSerbianShoshoneSierra LeoneanSiouxSlavicSlovakSloveneSomaliSouth AfricanSouth AmericanSouth American IndianSoviet UnionSpaniardSpanishSpanish AmericanSpanish American IndianSri LankanSubsaharan AfricanSudaneseSwedishSwissSyrianTaiwaneseThaiTlingit-HaidaTohono O'OdhamTonganTrinidadian and TobagonianTsimshianTurkishU.S. Virgin IslanderUgandanUkrainianUruguayanUteVenezuelanVietnameseWelshWest IndianYakamaYaquiYugoslavianYumanYup'ikZimbabwean
Immigration
NonimmigrantsImmigrantsAfghanistanAfricaAlbaniaArgentinaArmeniaAsiaAustraliaAustriaBahamasBangladeshBarbadosBelarusBelgiumBelizeBoliviaBosnia and HerzegovinaBrazilBulgariaBurma/MyanmarCabo VerdeCambodiaCameroonCanadaCaribbeanCentral AmericaChileChinaColombiaCongoCosta RicaCroatiaCubaCzechoslovakiaDenmarkDominicaDominican RepublicEastern AfricaEastern AsiaEastern EuropeEcuadorEgyptEl SalvadorEnglandEritreaEthiopiaEuropeFijiFranceGermanyGhanaGreeceGrenadaGuatemalaGuyanaHaitiHondurasHong KongHungaryIndiaIndonesiaIranIraqIrelandIsraelItalyJamaicaJapanJordanKazakhstanKenyaKoreaKuwaitLaosLatin AmericaLatviaLebanonLiberiaLithuaniaMalaysiaMexicoMicronesiaMiddle AfricaMoldovaMoroccoNepalNetherlandsNicaraguaNigeriaNorth AmericaNorth MacedoniaNorthern AfricaNorthern EuropeNorwayOceaniaPakistanPanamaPeruPhilippinesPolandPortugalRomaniaRussiaSaudi ArabiaScotlandSenegalSerbiaSierra LeoneSingaporeSomaliaSouth AfricaSouth AmericaSouth Central AsiaSouth Eastern AsiaSouthern EuropeSpainSri LankaSt. Vincent and the GrenadinesSudanSwedenSwitzerlandSyriaTaiwanThailandTrinidad and TobagoTurkeyUgandaUkraineUruguayUzbekistanVenezuelaVietnamWest IndiesWestern AfricaWestern AsiaWestern EuropeYemenZaireZimbabweAzores
Self-Care Disability
Income
Poverty
Unemployment
Labor Participation
Family Structure
Vehicle Availability
Education Level
Disability

Bahamian Self-Care Disability
Tragic

2.6%
SELF-CARE DISABILITY
2.0/ 100
METRIC RATING
235th/ 347
METRIC RANK

Bahamian Self-Care Disability Correlation Chart

The statistical analysis conducted on geographies consisting of 112,612,333 people shows a weak positive correlation between the proportion of Bahamians and percentage of population with self-care disability in the United States with a correlation coefficient (R) of 0.222 and weighted average of 2.6%. On average, for every 1% (one percent) increase in Bahamians within a typical geography, there is an increase of 0.14% in percentage of population with self-care disability.
Bahamian Self-Care Disability
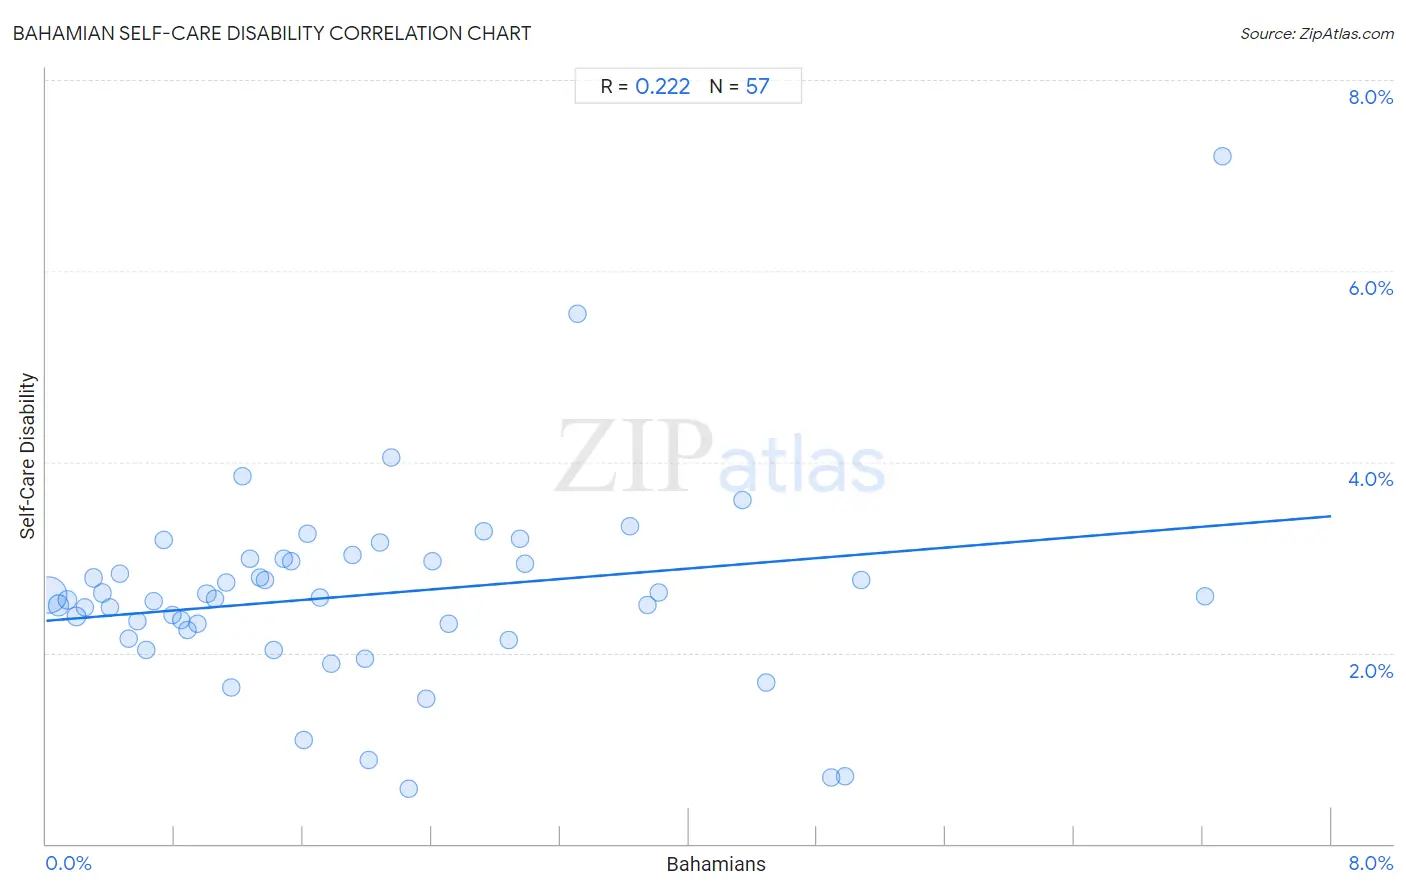
It is essential to understand that the correlation between the percentage of Bahamians and percentage of population with self-care disability does not imply a direct cause-and-effect relationship. It remains uncertain whether the presence of Bahamians influences an upward or downward trend in the level of percentage of population with self-care disability within an area, or if Bahamians simply ended up residing in those areas with higher or lower levels of percentage of population with self-care disability due to other factors.

Demographics Similar to Bahamians by Self-Care Disability

In terms of self-care disability, the demographic groups most similar to Bahamians are Liberian (2.6%, a difference of 0.040%), Vietnamese (2.6%, a difference of 0.040%), Bermudan (2.6%, a difference of 0.070%), Albanian (2.6%, a difference of 0.090%), and Immigrants from Guatemala (2.6%, a difference of 0.11%).
DemographicsRating | RankSelf-Care Disability
Guatemalans
2.7
/100
|
#228
Tragic
2.6%
Guamanians/Chamorros
2.5
/100
|
#229
Tragic
2.6%
Immigrants from Ecuador
2.5
/100
|
#230
Tragic
2.6%
Immigrants from Guatemala
2.2
/100
|
#231
Tragic
2.6%
Albanians
2.2
/100
|
#232
Tragic
2.6%
Liberians
2.1
/100
|
#233
Tragic
2.6%
Vietnamese
2.1
/100
|
#234
Tragic
2.6%
Bahamians
2.0
/100
|
#235
Tragic
2.6%
Bermudans
1.9
/100
|
#236
Tragic
2.6%
Immigrants from Senegal
1.6
/100
|
#237
Tragic
2.6%
Senegalese
1.3
/100
|
#238
Tragic
2.6%
Immigrants from Panama
1.2
/100
|
#239
Tragic
2.6%
Marshallese
1.2
/100
|
#240
Tragic
2.6%
Immigrants from Syria
1.0
/100
|
#241
Tragic
2.6%
Spanish
0.8
/100
|
#242
Tragic
2.6%

Bahamian Self-Care Disability Correlation Summary

MeasurementBahamian DataSelf-Care Disability Data
Minimum0.017%0.58%
Maximum7.3%7.2%
Range7.3%6.6%
Mean2.0%2.6%
Median1.5%2.6%
Interquartile 25% (IQ1)0.76%2.2%
Interquartile 75% (IQ3)2.8%3.0%
Interquartile Range (IQR)2.0%0.77%
Standard Deviation (Sample)1.7%1.0%
Standard Deviation (Population)1.7%1.0%

Correlation Details

Bahamian PercentileSample SizeSelf-Care Disability
[
0.0%
-
0.5%
]
0.017%
79,565,8552.6%
[
0.0%
-
0.5%
]
0.077%
12,659,8312.5%
[
0.0%
-
0.5%
]
0.13%
6,200,7652.6%
[
0.0%
-
0.5%
]
0.19%
3,566,3552.4%
[
0.0%
-
0.5%
]
0.24%
1,428,9302.5%
[
0.0%
-
0.5%
]
0.29%
1,862,7522.8%
[
0.0%
-
0.5%
]
0.35%
889,4302.6%
[
0.0%
-
0.5%
]
0.40%
749,1432.5%
[
0.0%
-
0.5%
]
0.46%
706,2012.8%
[
0.5%
-
1.0%
]
0.51%
745,6182.1%
[
0.5%
-
1.0%
]
0.57%
565,4122.3%
[
0.5%
-
1.0%
]
0.62%
509,7672.0%
[
0.5%
-
1.0%
]
0.67%
574,6112.5%
[
0.5%
-
1.0%
]
0.73%
283,4313.2%
[
0.5%
-
1.0%
]
0.79%
221,7312.4%
[
0.5%
-
1.0%
]
0.84%
264,2432.3%
[
0.5%
-
1.0%
]
0.88%
135,6302.2%
[
0.5%
-
1.0%
]
0.94%
189,6492.3%
[
0.5%
-
1.0%
]
1.00%
296,4452.6%
[
1.0%
-
1.5%
]
1.05%
70,6622.6%
[
1.0%
-
1.5%
]
1.12%
46,6122.7%
[
1.0%
-
1.5%
]
1.15%
60,4361.6%
[
1.0%
-
1.5%
]
1.23%
31,5903.9%
[
1.0%
-
1.5%
]
1.27%
109,4053.0%
[
1.0%
-
1.5%
]
1.33%
74,2972.8%
[
1.0%
-
1.5%
]
1.36%
25,4732.8%
[
1.0%
-
1.5%
]
1.42%
19,0102.0%
[
1.0%
-
1.5%
]
1.48%
138,8613.0%
[
1.5%
-
2.0%
]
1.52%
176,7663.0%
[
1.5%
-
2.0%
]
1.60%
3,2471.1%
[
1.5%
-
2.0%
]
1.62%
48,0773.2%
[
1.5%
-
2.0%
]
1.70%
86,0972.6%
[
1.5%
-
2.0%
]
1.78%
3381.9%
[
1.5%
-
2.0%
]
1.91%
47,9813.0%
[
1.5%
-
2.0%
]
1.98%
14,1261.9%
[
2.0%
-
2.5%
]
2.01%
9470.87%
[
2.0%
-
2.5%
]
2.07%
8,3403.2%
[
2.0%
-
2.5%
]
2.15%
37,2744.0%
[
2.0%
-
2.5%
]
2.26%
2,3490.58%
[
2.0%
-
2.5%
]
2.37%
7,6891.5%
[
2.0%
-
2.5%
]
2.40%
16,4493.0%
[
2.5%
-
3.0%
]
2.51%
3,1922.3%
[
2.5%
-
3.0%
]
2.73%
48,7923.3%
[
2.5%
-
3.0%
]
2.88%
27,5832.1%
[
2.5%
-
3.0%
]
2.95%
8473.2%
[
2.5%
-
3.0%
]
2.98%
6,2662.9%
[
3.0%
-
3.5%
]
3.30%
7,3855.6%
[
3.5%
-
4.0%
]
3.64%
9,6773.3%
[
3.5%
-
4.0%
]
3.74%
1,9502.5%
[
3.5%
-
4.0%
]
3.81%
18,4872.6%
[
4.0%
-
4.5%
]
4.34%
8,1183.6%
[
4.0%
-
4.5%
]
4.48%
15,7351.7%
[
4.5%
-
5.0%
]
4.89%
2,1900.69%
[
4.5%
-
5.0%
]
4.97%
2,1510.71%
[
5.0%
-
5.5%
]
5.07%
2,4262.8%
[
7.0%
-
7.5%
]
7.21%
14,6982.6%
[
7.0%
-
7.5%
]
7.32%
1,0117.2%