Immigrants from Serbia Self-Care Disability
COMPARE
Immigrants from Serbia
Select to Compare
Self-Care Disability
Immigrants from Serbia Self-Care Disability
2.3%
SELF-CARE DISABILITY
99.6/ 100
METRIC RATING
52nd/ 347
METRIC RANK
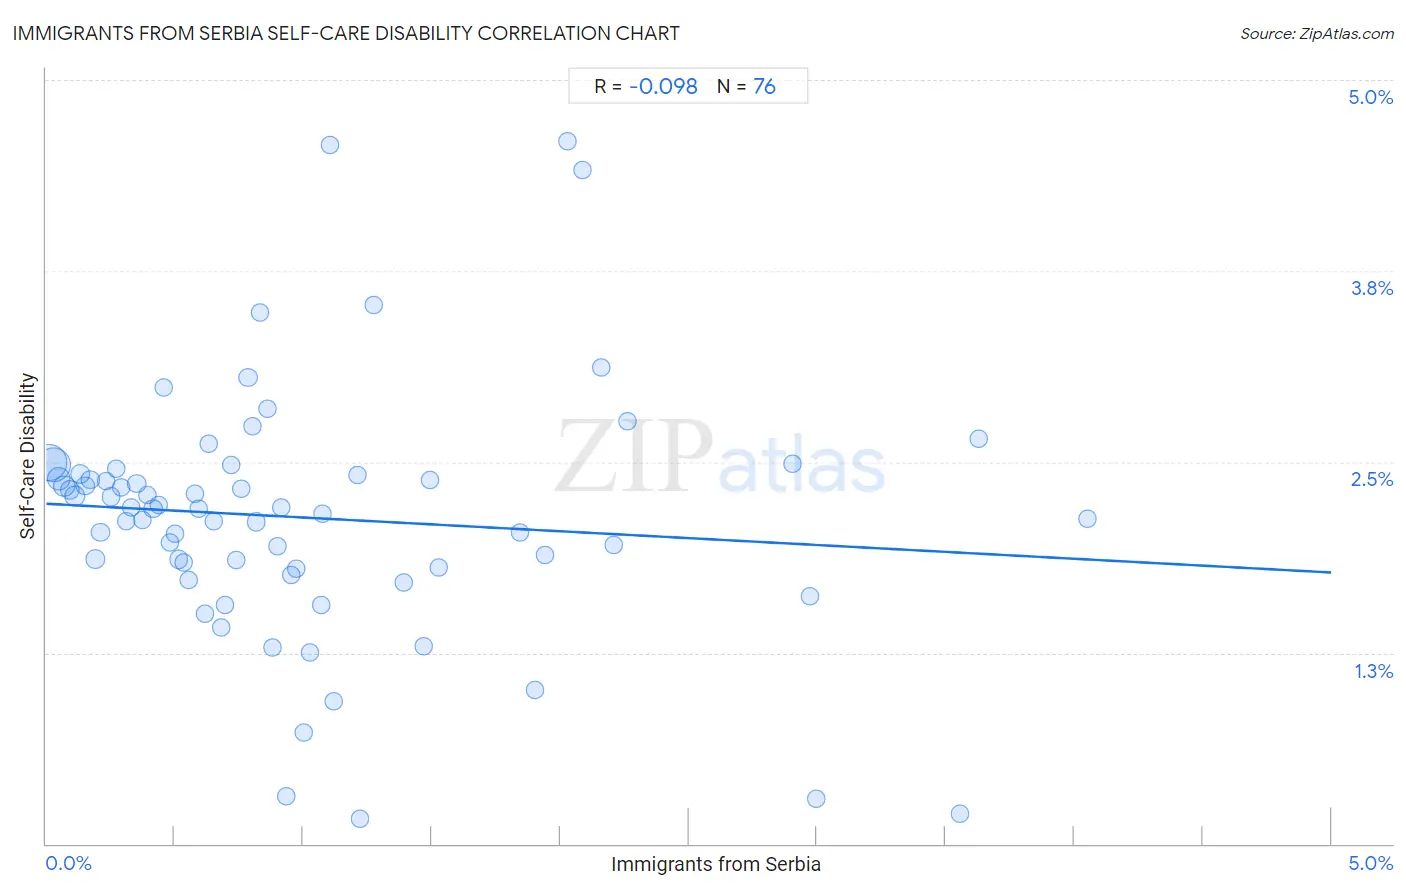
Immigrants from Serbia Self-Care Disability Correlation Chart
The statistical analysis conducted on geographies consisting of 131,686,608 people shows a slight negative correlation between the proportion of Immigrants from Serbia and percentage of population with self-care disability in the United States with a correlation coefficient (R) of -0.098 and weighted average of 2.3%. On average, for every 1% (one percent) increase in Immigrants from Serbia within a typical geography, there is a decrease of 0.090% in percentage of population with self-care disability.
It is essential to understand that the correlation between the percentage of Immigrants from Serbia and percentage of population with self-care disability does not imply a direct cause-and-effect relationship. It remains uncertain whether the presence of Immigrants from Serbia influences an upward or downward trend in the level of percentage of population with self-care disability within an area, or if Immigrants from Serbia simply ended up residing in those areas with higher or lower levels of percentage of population with self-care disability due to other factors.
Demographics Similar to Immigrants from Serbia by Self-Care Disability
In terms of self-care disability, the demographic groups most similar to Immigrants from Serbia are Kenyan (2.3%, a difference of 0.020%), Australian (2.3%, a difference of 0.030%), Argentinean (2.3%, a difference of 0.080%), Immigrants from France (2.3%, a difference of 0.14%), and Immigrants from Brazil (2.3%, a difference of 0.17%).
| Demographics | Rating | Rank | Self-Care Disability |
| Norwegians | 99.8 /100 | #45 | Exceptional 2.3% |
| Czechs | 99.8 /100 | #46 | Exceptional 2.3% |
| Jordanians | 99.7 /100 | #47 | Exceptional 2.3% |
| Immigrants from Malaysia | 99.7 /100 | #48 | Exceptional 2.3% |
| Latvians | 99.7 /100 | #49 | Exceptional 2.3% |
| Immigrants from Brazil | 99.7 /100 | #50 | Exceptional 2.3% |
| Kenyans | 99.7 /100 | #51 | Exceptional 2.3% |
| Immigrants from Serbia | 99.6 /100 | #52 | Exceptional 2.3% |
| Australians | 99.6 /100 | #53 | Exceptional 2.3% |
| Argentineans | 99.6 /100 | #54 | Exceptional 2.3% |
| Immigrants from France | 99.6 /100 | #55 | Exceptional 2.3% |
| Immigrants from Eastern Asia | 99.6 /100 | #56 | Exceptional 2.3% |
| Immigrants from Belgium | 99.6 /100 | #57 | Exceptional 2.3% |
| Immigrants from Cameroon | 99.6 /100 | #58 | Exceptional 2.3% |
| New Zealanders | 99.5 /100 | #59 | Exceptional 2.3% |
Immigrants from Serbia Self-Care Disability Correlation Summary
| Measurement | Immigrants from Serbia Data | Self-Care Disability Data |
| Minimum | 0.0098% | 0.16% |
| Maximum | 4.0% | 4.6% |
| Range | 4.0% | 4.4% |
| Mean | 1.0% | 2.1% |
| Median | 0.77% | 2.2% |
| Interquartile 25% (IQ1) | 0.38% | 1.8% |
| Interquartile 75% (IQ3) | 1.2% | 2.4% |
| Interquartile Range (IQR) | 0.86% | 0.61% |
| Standard Deviation (Sample) | 0.90% | 0.82% |
| Standard Deviation (Population) | 0.90% | 0.82% |
Correlation Details
| Immigrants from Serbia Percentile | Sample Size | Self-Care Disability |
[ 0.0% - 0.5% ] 0.0098% | 46,383,050 | 2.5% |
[ 0.0% - 0.5% ] 0.030% | 41,113,529 | 2.5% |
[ 0.0% - 0.5% ] 0.049% | 12,276,128 | 2.4% |
[ 0.0% - 0.5% ] 0.070% | 7,148,833 | 2.3% |
[ 0.0% - 0.5% ] 0.090% | 3,905,915 | 2.3% |
[ 0.0% - 0.5% ] 0.11% | 7,179,121 | 2.3% |
[ 0.0% - 0.5% ] 0.13% | 2,151,642 | 2.4% |
[ 0.0% - 0.5% ] 0.15% | 1,884,676 | 2.3% |
[ 0.0% - 0.5% ] 0.17% | 1,396,802 | 2.4% |
[ 0.0% - 0.5% ] 0.19% | 1,288,120 | 1.9% |
[ 0.0% - 0.5% ] 0.21% | 990,886 | 2.0% |
[ 0.0% - 0.5% ] 0.23% | 659,659 | 2.4% |
[ 0.0% - 0.5% ] 0.25% | 853,603 | 2.3% |
[ 0.0% - 0.5% ] 0.27% | 251,209 | 2.5% |
[ 0.0% - 0.5% ] 0.29% | 444,501 | 2.3% |
[ 0.0% - 0.5% ] 0.31% | 218,557 | 2.1% |
[ 0.0% - 0.5% ] 0.33% | 203,719 | 2.2% |
[ 0.0% - 0.5% ] 0.35% | 601,994 | 2.4% |
[ 0.0% - 0.5% ] 0.37% | 154,062 | 2.1% |
[ 0.0% - 0.5% ] 0.39% | 373,160 | 2.3% |
[ 0.0% - 0.5% ] 0.42% | 153,932 | 2.2% |
[ 0.0% - 0.5% ] 0.44% | 97,133 | 2.2% |
[ 0.0% - 0.5% ] 0.46% | 134,989 | 3.0% |
[ 0.0% - 0.5% ] 0.48% | 177,197 | 2.0% |
[ 0.0% - 0.5% ] 0.50% | 87,010 | 2.0% |
[ 0.5% - 1.0% ] 0.51% | 76,446 | 1.9% |
[ 0.5% - 1.0% ] 0.54% | 222,532 | 1.8% |
[ 0.5% - 1.0% ] 0.56% | 12,759 | 1.7% |
[ 0.5% - 1.0% ] 0.58% | 24,512 | 2.3% |
[ 0.5% - 1.0% ] 0.59% | 98,522 | 2.2% |
[ 0.5% - 1.0% ] 0.62% | 59,935 | 1.5% |
[ 0.5% - 1.0% ] 0.63% | 129,237 | 2.6% |
[ 0.5% - 1.0% ] 0.65% | 18,743 | 2.1% |
[ 0.5% - 1.0% ] 0.68% | 56,107 | 1.4% |
[ 0.5% - 1.0% ] 0.70% | 73,589 | 1.6% |
[ 0.5% - 1.0% ] 0.72% | 90,959 | 2.5% |
[ 0.5% - 1.0% ] 0.74% | 10,313 | 1.9% |
[ 0.5% - 1.0% ] 0.76% | 80,219 | 2.3% |
[ 0.5% - 1.0% ] 0.79% | 110,012 | 3.1% |
[ 0.5% - 1.0% ] 0.80% | 16,047 | 2.7% |
[ 0.5% - 1.0% ] 0.82% | 100,341 | 2.1% |
[ 0.5% - 1.0% ] 0.83% | 4,080 | 3.5% |
[ 0.5% - 1.0% ] 0.86% | 59,857 | 2.8% |
[ 0.5% - 1.0% ] 0.88% | 6,378 | 1.3% |
[ 0.5% - 1.0% ] 0.90% | 22,686 | 1.9% |
[ 0.5% - 1.0% ] 0.92% | 15,404 | 2.2% |
[ 0.5% - 1.0% ] 0.93% | 2,890 | 0.31% |
[ 0.5% - 1.0% ] 0.95% | 21,434 | 1.8% |
[ 0.5% - 1.0% ] 0.97% | 20,940 | 1.8% |
[ 1.0% - 1.5% ] 1.00% | 299 | 0.73% |
[ 1.0% - 1.5% ] 1.03% | 6,432 | 1.3% |
[ 1.0% - 1.5% ] 1.07% | 15,861 | 1.6% |
[ 1.0% - 1.5% ] 1.08% | 43,813 | 2.2% |
[ 1.0% - 1.5% ] 1.11% | 3,979 | 4.6% |
[ 1.0% - 1.5% ] 1.12% | 1,785 | 0.93% |
[ 1.0% - 1.5% ] 1.21% | 1,156 | 2.4% |
[ 1.0% - 1.5% ] 1.22% | 5,651 | 0.16% |
[ 1.0% - 1.5% ] 1.27% | 9,977 | 3.5% |
[ 1.0% - 1.5% ] 1.39% | 31,647 | 1.7% |
[ 1.0% - 1.5% ] 1.47% | 13,070 | 1.3% |
[ 1.0% - 1.5% ] 1.49% | 7,228 | 2.4% |
[ 1.5% - 2.0% ] 1.53% | 35,112 | 1.8% |
[ 1.5% - 2.0% ] 1.84% | 2,280 | 2.0% |
[ 1.5% - 2.0% ] 1.90% | 946 | 1.0% |
[ 1.5% - 2.0% ] 1.94% | 21,357 | 1.9% |
[ 2.0% - 2.5% ] 2.03% | 936 | 4.6% |
[ 2.0% - 2.5% ] 2.09% | 766 | 4.4% |
[ 2.0% - 2.5% ] 2.16% | 1,066 | 3.1% |
[ 2.0% - 2.5% ] 2.21% | 317 | 2.0% |
[ 2.0% - 2.5% ] 2.26% | 398 | 2.8% |
[ 2.5% - 3.0% ] 2.91% | 895 | 2.5% |
[ 2.5% - 3.0% ] 2.97% | 6,322 | 1.6% |
[ 2.5% - 3.0% ] 3.00% | 5,471 | 0.29% |
[ 3.5% - 4.0% ] 3.55% | 1,885 | 0.20% |
[ 3.5% - 4.0% ] 3.63% | 4,022 | 2.7% |
[ 4.0% - 4.5% ] 4.05% | 568 | 2.1% |