Scotch-Irish 4 or more Vehicles in Household
COMPARE
Scotch-Irish
Select to Compare
4 or more Vehicles in Household
Scotch-Irish 4 or more Vehicles in Household
7.4%
4+ VEHICLES AVAILABLE
99.9/ 100
METRIC RATING
72nd/ 347
METRIC RANK
Scotch-Irish 4 or more Vehicles in Household Correlation Chart
The statistical analysis conducted on geographies consisting of 546,031,323 people shows a substantial positive correlation between the proportion of Scotch-Irish and percentage of households with 4 or more vehicles available in the United States with a correlation coefficient (R) of 0.537 and weighted average of 7.4%. On average, for every 1% (one percent) increase in Scotch-Irish within a typical geography, there is an increase of 0.54% in percentage of households with 4 or more vehicles available.
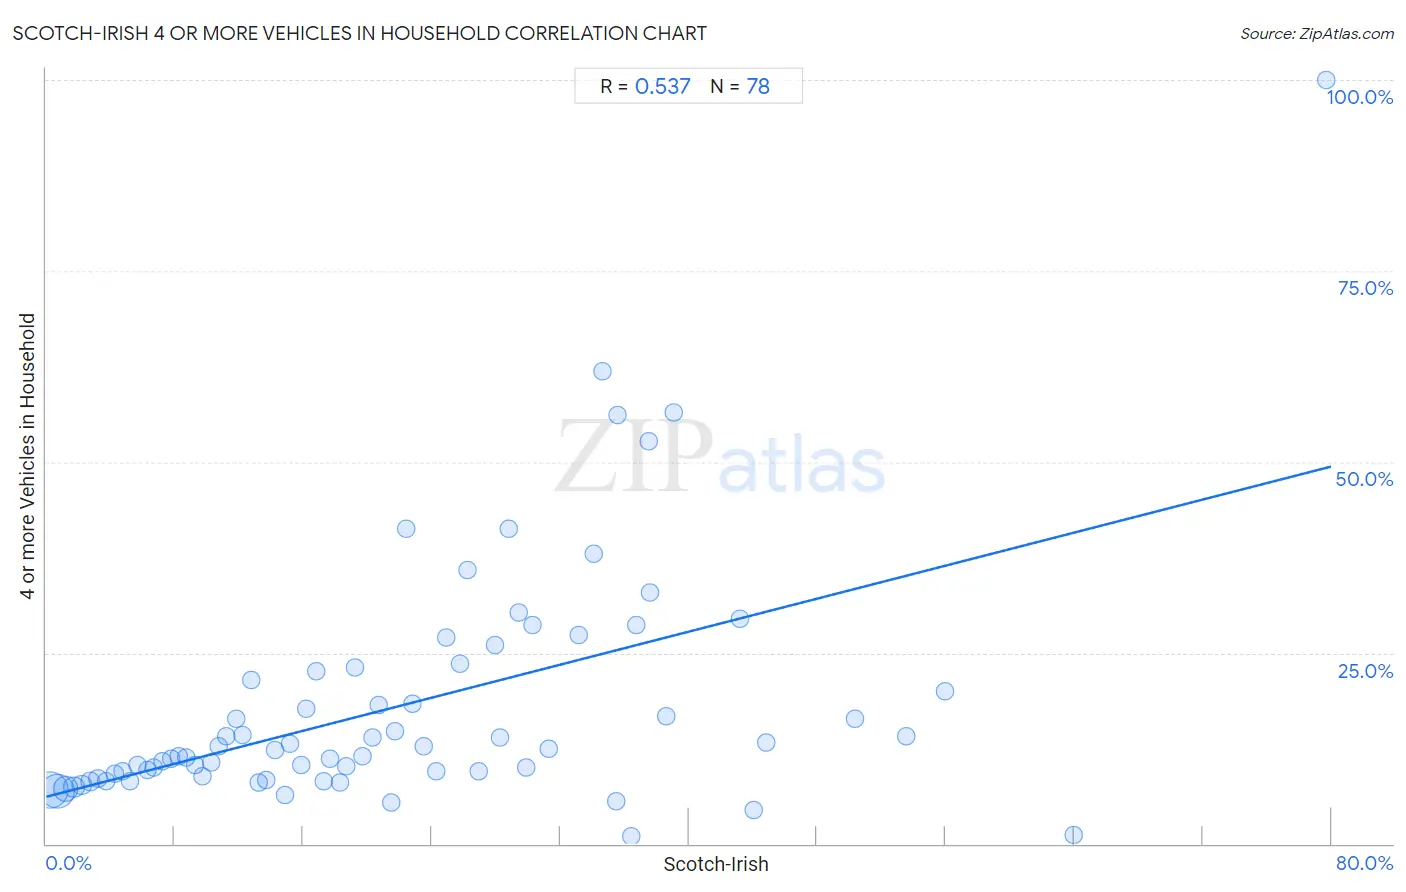
It is essential to understand that the correlation between the percentage of Scotch-Irish and percentage of households with 4 or more vehicles available does not imply a direct cause-and-effect relationship. It remains uncertain whether the presence of Scotch-Irish influences an upward or downward trend in the level of percentage of households with 4 or more vehicles available within an area, or if Scotch-Irish simply ended up residing in those areas with higher or lower levels of percentage of households with 4 or more vehicles available due to other factors.
Demographics Similar to Scotch-Irish by 4 or more Vehicles in Household
In terms of 4 or more vehicles in household, the demographic groups most similar to Scotch-Irish are Portuguese (7.4%, a difference of 0.090%), Chickasaw (7.4%, a difference of 0.30%), Icelander (7.4%, a difference of 0.39%), Immigrants from Cambodia (7.4%, a difference of 0.40%), and Scottish (7.4%, a difference of 0.43%).
| Demographics | Rating | Rank | 4 or more Vehicles in Household |
| Immigrants from the Azores | 100.0 /100 | #65 | Exceptional 7.5% |
| Immigrants from Taiwan | 99.9 /100 | #66 | Exceptional 7.5% |
| Americans | 99.9 /100 | #67 | Exceptional 7.5% |
| Welsh | 99.9 /100 | #68 | Exceptional 7.5% |
| Germans | 99.9 /100 | #69 | Exceptional 7.5% |
| Scottish | 99.9 /100 | #70 | Exceptional 7.4% |
| Chickasaw | 99.9 /100 | #71 | Exceptional 7.4% |
| Scotch-Irish | 99.9 /100 | #72 | Exceptional 7.4% |
| Portuguese | 99.9 /100 | #73 | Exceptional 7.4% |
| Icelanders | 99.9 /100 | #74 | Exceptional 7.4% |
| Immigrants from Cambodia | 99.9 /100 | #75 | Exceptional 7.4% |
| Laotians | 99.9 /100 | #76 | Exceptional 7.4% |
| Apache | 99.9 /100 | #77 | Exceptional 7.4% |
| Whites/Caucasians | 99.8 /100 | #78 | Exceptional 7.4% |
| Czechs | 99.8 /100 | #79 | Exceptional 7.4% |
Scotch-Irish 4 or more Vehicles in Household Correlation Summary
| Measurement | Scotch-Irish Data | 4 or more Vehicles in Household Data |
| Minimum | 0.25% | 0.97% |
| Maximum | 79.7% | 100.0% |
| Range | 79.4% | 99.0% |
| Mean | 22.1% | 18.1% |
| Median | 19.5% | 12.4% |
| Interquartile 25% (IQ1) | 9.8% | 8.8% |
| Interquartile 75% (IQ3) | 31.2% | 22.6% |
| Interquartile Range (IQR) | 21.5% | 13.8% |
| Standard Deviation (Sample) | 15.8% | 16.0% |
| Standard Deviation (Population) | 15.7% | 15.8% |
Correlation Details
| Scotch-Irish Percentile | Sample Size | 4 or more Vehicles in Household |
[ 0.0% - 0.5% ] 0.25% | 209,332,242 | 7.0% |
[ 0.5% - 1.0% ] 0.72% | 182,733,474 | 7.0% |
[ 1.0% - 1.5% ] 1.21% | 82,447,851 | 7.1% |
[ 1.5% - 2.0% ] 1.72% | 36,380,018 | 7.4% |
[ 2.0% - 2.5% ] 2.21% | 15,844,052 | 7.6% |
[ 2.5% - 3.0% ] 2.73% | 7,823,113 | 8.1% |
[ 3.0% - 3.5% ] 3.23% | 5,094,013 | 8.5% |
[ 3.5% - 4.0% ] 3.75% | 2,445,958 | 8.2% |
[ 4.0% - 4.5% ] 4.25% | 1,258,648 | 9.1% |
[ 4.5% - 5.0% ] 4.75% | 729,238 | 9.5% |
[ 5.0% - 5.5% ] 5.23% | 629,905 | 8.3% |
[ 5.5% - 6.0% ] 5.71% | 317,618 | 10.2% |
[ 6.0% - 6.5% ] 6.29% | 201,040 | 9.6% |
[ 6.5% - 7.0% ] 6.71% | 130,723 | 10.0% |
[ 7.0% - 7.5% ] 7.23% | 114,509 | 10.8% |
[ 7.5% - 8.0% ] 7.79% | 109,589 | 11.1% |
[ 8.0% - 8.5% ] 8.22% | 75,211 | 11.4% |
[ 8.5% - 9.0% ] 8.75% | 59,981 | 11.3% |
[ 9.0% - 9.5% ] 9.25% | 39,297 | 10.3% |
[ 9.5% - 10.0% ] 9.75% | 35,482 | 8.8% |
[ 10.0% - 10.5% ] 10.27% | 37,192 | 10.6% |
[ 10.5% - 11.0% ] 10.70% | 25,764 | 12.8% |
[ 11.0% - 11.5% ] 11.23% | 17,700 | 14.1% |
[ 11.5% - 12.0% ] 11.80% | 17,539 | 16.4% |
[ 12.0% - 12.5% ] 12.25% | 7,663 | 14.3% |
[ 12.5% - 13.0% ] 12.76% | 4,397 | 21.4% |
[ 13.0% - 13.5% ] 13.22% | 18,564 | 8.0% |
[ 13.5% - 14.0% ] 13.70% | 16,193 | 8.3% |
[ 14.0% - 14.5% ] 14.25% | 15,134 | 12.2% |
[ 14.5% - 15.0% ] 14.85% | 2,162 | 6.3% |
[ 15.0% - 15.5% ] 15.14% | 6,063 | 13.1% |
[ 15.5% - 16.0% ] 15.86% | 4,647 | 10.3% |
[ 16.0% - 16.5% ] 16.21% | 10,547 | 17.6% |
[ 16.5% - 17.0% ] 16.80% | 4,023 | 22.6% |
[ 17.0% - 17.5% ] 17.24% | 6,096 | 8.3% |
[ 17.5% - 18.0% ] 17.66% | 9,035 | 11.2% |
[ 18.0% - 18.5% ] 18.30% | 1,661 | 8.0% |
[ 18.5% - 19.0% ] 18.65% | 3,018 | 10.1% |
[ 19.0% - 19.5% ] 19.21% | 1,853 | 23.0% |
[ 19.5% - 20.0% ] 19.73% | 1,171 | 11.5% |
[ 20.0% - 20.5% ] 20.31% | 389 | 14.0% |
[ 20.5% - 21.0% ] 20.73% | 2,480 | 18.2% |
[ 21.0% - 21.5% ] 21.47% | 368 | 5.4% |
[ 21.5% - 22.0% ] 21.72% | 1,805 | 14.8% |
[ 22.0% - 22.5% ] 22.45% | 49 | 41.2% |
[ 22.5% - 23.0% ] 22.76% | 1,375 | 18.3% |
[ 23.0% - 23.5% ] 23.48% | 903 | 12.8% |
[ 24.0% - 24.5% ] 24.30% | 251 | 9.4% |
[ 24.5% - 25.0% ] 24.88% | 1,688 | 27.1% |
[ 25.5% - 26.0% ] 25.79% | 570 | 23.6% |
[ 26.0% - 26.5% ] 26.19% | 168 | 35.8% |
[ 26.5% - 27.0% ] 26.91% | 431 | 9.5% |
[ 27.5% - 28.0% ] 27.91% | 86 | 26.1% |
[ 28.0% - 28.5% ] 28.26% | 92 | 13.9% |
[ 28.5% - 29.0% ] 28.76% | 466 | 41.3% |
[ 29.0% - 29.5% ] 29.42% | 469 | 30.3% |
[ 29.5% - 30.0% ] 29.91% | 662 | 10.0% |
[ 30.0% - 30.5% ] 30.24% | 1,872 | 28.6% |
[ 31.0% - 31.5% ] 31.25% | 32 | 12.5% |
[ 33.0% - 33.5% ] 33.12% | 157 | 27.3% |
[ 34.0% - 34.5% ] 34.12% | 847 | 38.0% |
[ 34.5% - 35.0% ] 34.62% | 234 | 61.8% |
[ 35.0% - 35.5% ] 35.46% | 141 | 5.5% |
[ 35.5% - 36.0% ] 35.54% | 166 | 56.1% |
[ 36.0% - 36.5% ] 36.40% | 728 | 0.97% |
[ 36.5% - 37.0% ] 36.73% | 49 | 28.6% |
[ 37.0% - 37.5% ] 37.50% | 72 | 52.6% |
[ 37.5% - 38.0% ] 37.58% | 157 | 32.8% |
[ 38.5% - 39.0% ] 38.60% | 171 | 16.7% |
[ 39.0% - 39.5% ] 39.08% | 87 | 56.5% |
[ 43.0% - 43.5% ] 43.17% | 556 | 29.4% |
[ 44.0% - 44.5% ] 44.08% | 338 | 4.3% |
[ 44.5% - 45.0% ] 44.84% | 339 | 13.3% |
[ 50.0% - 50.5% ] 50.34% | 149 | 16.4% |
[ 53.5% - 54.0% ] 53.51% | 299 | 14.1% |
[ 55.5% - 56.0% ] 55.93% | 59 | 20.0% |
[ 64.0% - 64.5% ] 64.00% | 175 | 1.1% |
[ 79.5% - 80.0% ] 79.66% | 59 | 100.0% |