Immigrants from Kenya Self-Care Disability
COMPARE
Immigrants from Kenya
Select to Compare
Self-Care Disability
Immigrants from Kenya Self-Care Disability
2.3%
SELF-CARE DISABILITY
99.0/ 100
METRIC RATING
79th/ 347
METRIC RANK
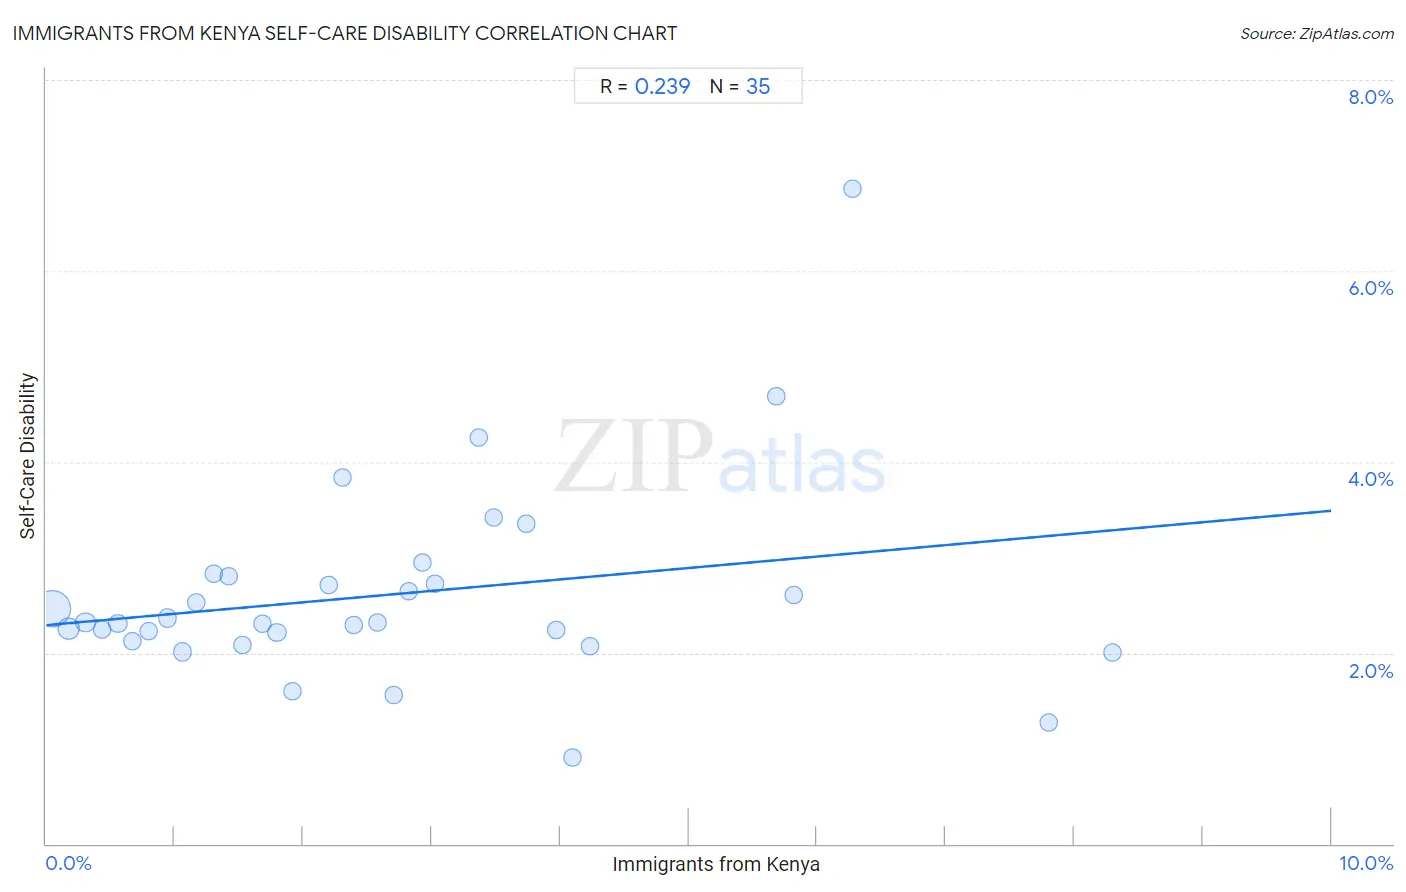
Immigrants from Kenya Self-Care Disability Correlation Chart
The statistical analysis conducted on geographies consisting of 217,918,601 people shows a weak positive correlation between the proportion of Immigrants from Kenya and percentage of population with self-care disability in the United States with a correlation coefficient (R) of 0.239 and weighted average of 2.3%. On average, for every 1% (one percent) increase in Immigrants from Kenya within a typical geography, there is an increase of 0.12% in percentage of population with self-care disability.
It is essential to understand that the correlation between the percentage of Immigrants from Kenya and percentage of population with self-care disability does not imply a direct cause-and-effect relationship. It remains uncertain whether the presence of Immigrants from Kenya influences an upward or downward trend in the level of percentage of population with self-care disability within an area, or if Immigrants from Kenya simply ended up residing in those areas with higher or lower levels of percentage of population with self-care disability due to other factors.
Demographics Similar to Immigrants from Kenya by Self-Care Disability
In terms of self-care disability, the demographic groups most similar to Immigrants from Kenya are Immigrants from Middle Africa (2.3%, a difference of 0.010%), Immigrants from Ireland (2.3%, a difference of 0.010%), Immigrants from China (2.3%, a difference of 0.090%), Immigrants from Netherlands (2.3%, a difference of 0.10%), and Immigrants from Switzerland (2.3%, a difference of 0.14%).
| Demographics | Rating | Rank | Self-Care Disability |
| Eastern Europeans | 99.2 /100 | #72 | Exceptional 2.3% |
| Immigrants from Egypt | 99.1 /100 | #73 | Exceptional 2.3% |
| Immigrants from Switzerland | 99.1 /100 | #74 | Exceptional 2.3% |
| Immigrants from Netherlands | 99.1 /100 | #75 | Exceptional 2.3% |
| Immigrants from China | 99.1 /100 | #76 | Exceptional 2.3% |
| Immigrants from Middle Africa | 99.0 /100 | #77 | Exceptional 2.3% |
| Immigrants from Ireland | 99.0 /100 | #78 | Exceptional 2.3% |
| Immigrants from Kenya | 99.0 /100 | #79 | Exceptional 2.3% |
| Chileans | 98.8 /100 | #80 | Exceptional 2.3% |
| Ugandans | 98.8 /100 | #81 | Exceptional 2.3% |
| Immigrants from Denmark | 98.8 /100 | #82 | Exceptional 2.3% |
| Indians (Asian) | 98.7 /100 | #83 | Exceptional 2.3% |
| Immigrants from Spain | 98.7 /100 | #84 | Exceptional 2.3% |
| Estonians | 98.3 /100 | #85 | Exceptional 2.3% |
| Immigrants from Northern Africa | 98.2 /100 | #86 | Exceptional 2.3% |
Immigrants from Kenya Self-Care Disability Correlation Summary
| Measurement | Immigrants from Kenya Data | Self-Care Disability Data |
| Minimum | 0.045% | 0.90% |
| Maximum | 8.3% | 6.9% |
| Range | 8.3% | 6.0% |
| Mean | 2.7% | 2.6% |
| Median | 2.3% | 2.3% |
| Interquartile 25% (IQ1) | 1.1% | 2.1% |
| Interquartile 75% (IQ3) | 3.7% | 2.8% |
| Interquartile Range (IQR) | 2.7% | 0.68% |
| Standard Deviation (Sample) | 2.1% | 1.1% |
| Standard Deviation (Population) | 2.1% | 1.0% |
Correlation Details
| Immigrants from Kenya Percentile | Sample Size | Self-Care Disability |
[ 0.0% - 0.5% ] 0.045% | 154,701,918 | 2.5% |
[ 0.0% - 0.5% ] 0.17% | 33,122,577 | 2.3% |
[ 0.0% - 0.5% ] 0.31% | 12,092,194 | 2.3% |
[ 0.0% - 0.5% ] 0.44% | 6,459,528 | 2.2% |
[ 0.5% - 1.0% ] 0.56% | 3,967,322 | 2.3% |
[ 0.5% - 1.0% ] 0.67% | 1,893,811 | 2.1% |
[ 0.5% - 1.0% ] 0.79% | 1,463,629 | 2.2% |
[ 0.5% - 1.0% ] 0.94% | 976,252 | 2.4% |
[ 1.0% - 1.5% ] 1.06% | 818,109 | 2.0% |
[ 1.0% - 1.5% ] 1.16% | 569,812 | 2.5% |
[ 1.0% - 1.5% ] 1.30% | 388,788 | 2.8% |
[ 1.0% - 1.5% ] 1.42% | 305,227 | 2.8% |
[ 1.5% - 2.0% ] 1.53% | 261,143 | 2.1% |
[ 1.5% - 2.0% ] 1.68% | 109,712 | 2.3% |
[ 1.5% - 2.0% ] 1.79% | 229,633 | 2.2% |
[ 1.5% - 2.0% ] 1.92% | 113,720 | 1.6% |
[ 2.0% - 2.5% ] 2.20% | 191,120 | 2.7% |
[ 2.0% - 2.5% ] 2.30% | 9,682 | 3.8% |
[ 2.0% - 2.5% ] 2.39% | 55,332 | 2.3% |
[ 2.5% - 3.0% ] 2.58% | 27,290 | 2.3% |
[ 2.5% - 3.0% ] 2.71% | 14,076 | 1.6% |
[ 2.5% - 3.0% ] 2.82% | 61,578 | 2.7% |
[ 2.5% - 3.0% ] 2.93% | 16,884 | 2.9% |
[ 3.0% - 3.5% ] 3.02% | 16,947 | 2.7% |
[ 3.0% - 3.5% ] 3.36% | 2,618 | 4.2% |
[ 3.0% - 3.5% ] 3.48% | 2,154 | 3.4% |
[ 3.5% - 4.0% ] 3.74% | 10,811 | 3.4% |
[ 3.5% - 4.0% ] 3.96% | 227 | 2.2% |
[ 4.0% - 4.5% ] 4.10% | 2,464 | 0.90% |
[ 4.0% - 4.5% ] 4.23% | 24,008 | 2.1% |
[ 5.5% - 6.0% ] 5.68% | 3,838 | 4.7% |
[ 5.5% - 6.0% ] 5.82% | 3,214 | 2.6% |
[ 6.0% - 6.5% ] 6.27% | 1,403 | 6.9% |
[ 7.5% - 8.0% ] 7.80% | 423 | 1.3% |
[ 8.0% - 8.5% ] 8.30% | 1,157 | 2.0% |