Immigrants from Sri Lanka Self-Care Disability
COMPARE
Immigrants from Sri Lanka
Select to Compare
Self-Care Disability
Immigrants from Sri Lanka Self-Care Disability
2.2%
SELF-CARE DISABILITY
99.9/ 100
METRIC RATING
26th/ 347
METRIC RANK
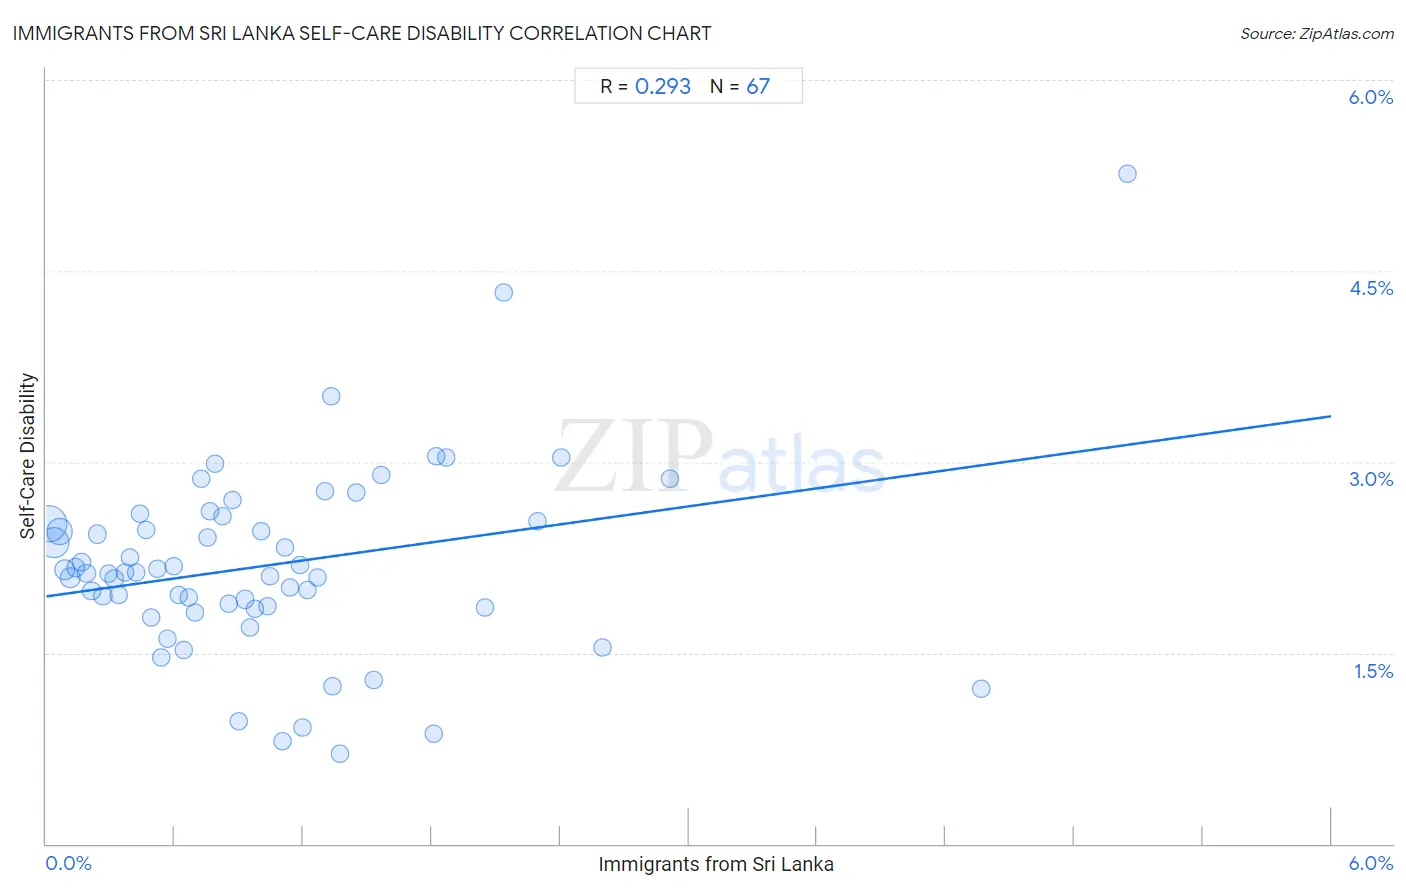
Immigrants from Sri Lanka Self-Care Disability Correlation Chart
The statistical analysis conducted on geographies consisting of 149,648,116 people shows a weak positive correlation between the proportion of Immigrants from Sri Lanka and percentage of population with self-care disability in the United States with a correlation coefficient (R) of 0.293 and weighted average of 2.2%. On average, for every 1% (one percent) increase in Immigrants from Sri Lanka within a typical geography, there is an increase of 0.24% in percentage of population with self-care disability.
It is essential to understand that the correlation between the percentage of Immigrants from Sri Lanka and percentage of population with self-care disability does not imply a direct cause-and-effect relationship. It remains uncertain whether the presence of Immigrants from Sri Lanka influences an upward or downward trend in the level of percentage of population with self-care disability within an area, or if Immigrants from Sri Lanka simply ended up residing in those areas with higher or lower levels of percentage of population with self-care disability due to other factors.
Demographics Similar to Immigrants from Sri Lanka by Self-Care Disability
In terms of self-care disability, the demographic groups most similar to Immigrants from Sri Lanka are Venezuelan (2.2%, a difference of 0.010%), Turkish (2.2%, a difference of 0.070%), Inupiat (2.2%, a difference of 0.17%), Cypriot (2.2%, a difference of 0.18%), and Immigrants from Zimbabwe (2.3%, a difference of 0.26%).
| Demographics | Rating | Rank | Self-Care Disability |
| Immigrants from Eritrea | 100.0 /100 | #19 | Exceptional 2.2% |
| Tongans | 100.0 /100 | #20 | Exceptional 2.2% |
| Bulgarians | 100.0 /100 | #21 | Exceptional 2.2% |
| Immigrants from Venezuela | 100.0 /100 | #22 | Exceptional 2.2% |
| Cambodians | 100.0 /100 | #23 | Exceptional 2.2% |
| Cypriots | 100.0 /100 | #24 | Exceptional 2.2% |
| Turks | 100.0 /100 | #25 | Exceptional 2.2% |
| Immigrants from Sri Lanka | 99.9 /100 | #26 | Exceptional 2.2% |
| Venezuelans | 99.9 /100 | #27 | Exceptional 2.2% |
| Inupiat | 99.9 /100 | #28 | Exceptional 2.2% |
| Immigrants from Zimbabwe | 99.9 /100 | #29 | Exceptional 2.3% |
| Paraguayans | 99.9 /100 | #30 | Exceptional 2.3% |
| Danes | 99.9 /100 | #31 | Exceptional 2.3% |
| Burmese | 99.9 /100 | #32 | Exceptional 2.3% |
| Immigrants from Korea | 99.9 /100 | #33 | Exceptional 2.3% |
Immigrants from Sri Lanka Self-Care Disability Correlation Summary
| Measurement | Immigrants from Sri Lanka Data | Self-Care Disability Data |
| Minimum | 0.013% | 0.71% |
| Maximum | 5.0% | 5.3% |
| Range | 5.0% | 4.6% |
| Mean | 1.0% | 2.2% |
| Median | 0.85% | 2.1% |
| Interquartile 25% (IQ1) | 0.42% | 1.9% |
| Interquartile 75% (IQ3) | 1.3% | 2.5% |
| Interquartile Range (IQR) | 0.91% | 0.68% |
| Standard Deviation (Sample) | 0.93% | 0.75% |
| Standard Deviation (Population) | 0.92% | 0.74% |
Correlation Details
| Immigrants from Sri Lanka Percentile | Sample Size | Self-Care Disability |
[ 0.0% - 0.5% ] 0.013% | 55,626,613 | 2.5% |
[ 0.0% - 0.5% ] 0.037% | 36,314,504 | 2.4% |
[ 0.0% - 0.5% ] 0.062% | 24,312,188 | 2.5% |
[ 0.0% - 0.5% ] 0.087% | 8,897,531 | 2.1% |
[ 0.0% - 0.5% ] 0.11% | 6,231,687 | 2.1% |
[ 0.0% - 0.5% ] 0.14% | 3,267,387 | 2.2% |
[ 0.0% - 0.5% ] 0.16% | 2,210,902 | 2.2% |
[ 0.0% - 0.5% ] 0.19% | 2,537,880 | 2.1% |
[ 0.0% - 0.5% ] 0.21% | 1,564,987 | 2.0% |
[ 0.0% - 0.5% ] 0.24% | 1,147,156 | 2.4% |
[ 0.0% - 0.5% ] 0.27% | 1,424,637 | 1.9% |
[ 0.0% - 0.5% ] 0.29% | 848,138 | 2.1% |
[ 0.0% - 0.5% ] 0.32% | 746,064 | 2.1% |
[ 0.0% - 0.5% ] 0.34% | 425,560 | 2.0% |
[ 0.0% - 0.5% ] 0.37% | 300,078 | 2.1% |
[ 0.0% - 0.5% ] 0.39% | 282,864 | 2.3% |
[ 0.0% - 0.5% ] 0.42% | 645,791 | 2.1% |
[ 0.0% - 0.5% ] 0.44% | 270,204 | 2.6% |
[ 0.0% - 0.5% ] 0.47% | 503,926 | 2.5% |
[ 0.0% - 0.5% ] 0.49% | 275,868 | 1.8% |
[ 0.5% - 1.0% ] 0.52% | 132,774 | 2.2% |
[ 0.5% - 1.0% ] 0.54% | 170,558 | 1.5% |
[ 0.5% - 1.0% ] 0.57% | 235,928 | 1.6% |
[ 0.5% - 1.0% ] 0.60% | 143,787 | 2.2% |
[ 0.5% - 1.0% ] 0.62% | 48,463 | 2.0% |
[ 0.5% - 1.0% ] 0.64% | 31,999 | 1.5% |
[ 0.5% - 1.0% ] 0.67% | 47,050 | 1.9% |
[ 0.5% - 1.0% ] 0.70% | 116,022 | 1.8% |
[ 0.5% - 1.0% ] 0.72% | 73,852 | 2.9% |
[ 0.5% - 1.0% ] 0.75% | 15,177 | 2.4% |
[ 0.5% - 1.0% ] 0.76% | 104,875 | 2.6% |
[ 0.5% - 1.0% ] 0.79% | 39,791 | 3.0% |
[ 0.5% - 1.0% ] 0.82% | 31,743 | 2.6% |
[ 0.5% - 1.0% ] 0.85% | 18,482 | 1.9% |
[ 0.5% - 1.0% ] 0.87% | 52,558 | 2.7% |
[ 0.5% - 1.0% ] 0.90% | 4,669 | 0.97% |
[ 0.5% - 1.0% ] 0.93% | 64,339 | 1.9% |
[ 0.5% - 1.0% ] 0.95% | 65,148 | 1.7% |
[ 0.5% - 1.0% ] 0.98% | 63,423 | 1.8% |
[ 1.0% - 1.5% ] 1.01% | 51,470 | 2.5% |
[ 1.0% - 1.5% ] 1.03% | 2,997 | 1.9% |
[ 1.0% - 1.5% ] 1.05% | 28,514 | 2.1% |
[ 1.0% - 1.5% ] 1.10% | 10,516 | 0.80% |
[ 1.0% - 1.5% ] 1.12% | 35,378 | 2.3% |
[ 1.0% - 1.5% ] 1.14% | 8,071 | 2.0% |
[ 1.0% - 1.5% ] 1.19% | 26,239 | 2.2% |
[ 1.0% - 1.5% ] 1.20% | 17,308 | 0.91% |
[ 1.0% - 1.5% ] 1.22% | 45,052 | 2.0% |
[ 1.0% - 1.5% ] 1.27% | 4,254 | 2.1% |
[ 1.0% - 1.5% ] 1.30% | 20,325 | 2.8% |
[ 1.0% - 1.5% ] 1.33% | 8,956 | 3.5% |
[ 1.0% - 1.5% ] 1.34% | 1,570 | 1.2% |
[ 1.0% - 1.5% ] 1.37% | 9,324 | 0.71% |
[ 1.0% - 1.5% ] 1.45% | 4,761 | 2.8% |
[ 1.5% - 2.0% ] 1.53% | 1,308 | 1.3% |
[ 1.5% - 2.0% ] 1.57% | 27,083 | 2.9% |
[ 1.5% - 2.0% ] 1.81% | 2,653 | 0.86% |
[ 1.5% - 2.0% ] 1.82% | 2,585 | 3.0% |
[ 1.5% - 2.0% ] 1.87% | 18,567 | 3.0% |
[ 2.0% - 2.5% ] 2.05% | 1,026 | 1.9% |
[ 2.0% - 2.5% ] 2.14% | 468 | 4.3% |
[ 2.0% - 2.5% ] 2.30% | 4,181 | 2.5% |
[ 2.0% - 2.5% ] 2.40% | 208 | 3.0% |
[ 2.5% - 3.0% ] 2.60% | 4,851 | 1.5% |
[ 2.5% - 3.0% ] 2.91% | 9,312 | 2.9% |
[ 4.0% - 4.5% ] 4.36% | 1,146 | 1.2% |
[ 5.0% - 5.5% ] 5.05% | 5,390 | 5.3% |