Spanish American Self-Care Disability
COMPARE
Spanish American
Select to Compare
Self-Care Disability
Spanish American Self-Care Disability
2.8%
SELF-CARE DISABILITY
0.0/ 100
METRIC RATING
313th/ 347
METRIC RANK
Spanish American Self-Care Disability Correlation Chart
The statistical analysis conducted on geographies consisting of 103,142,959 people shows a significant positive correlation between the proportion of Spanish Americans and percentage of population with self-care disability in the United States with a correlation coefficient (R) of 0.657 and weighted average of 2.8%. On average, for every 1% (one percent) increase in Spanish Americans within a typical geography, there is an increase of 0.36% in percentage of population with self-care disability.
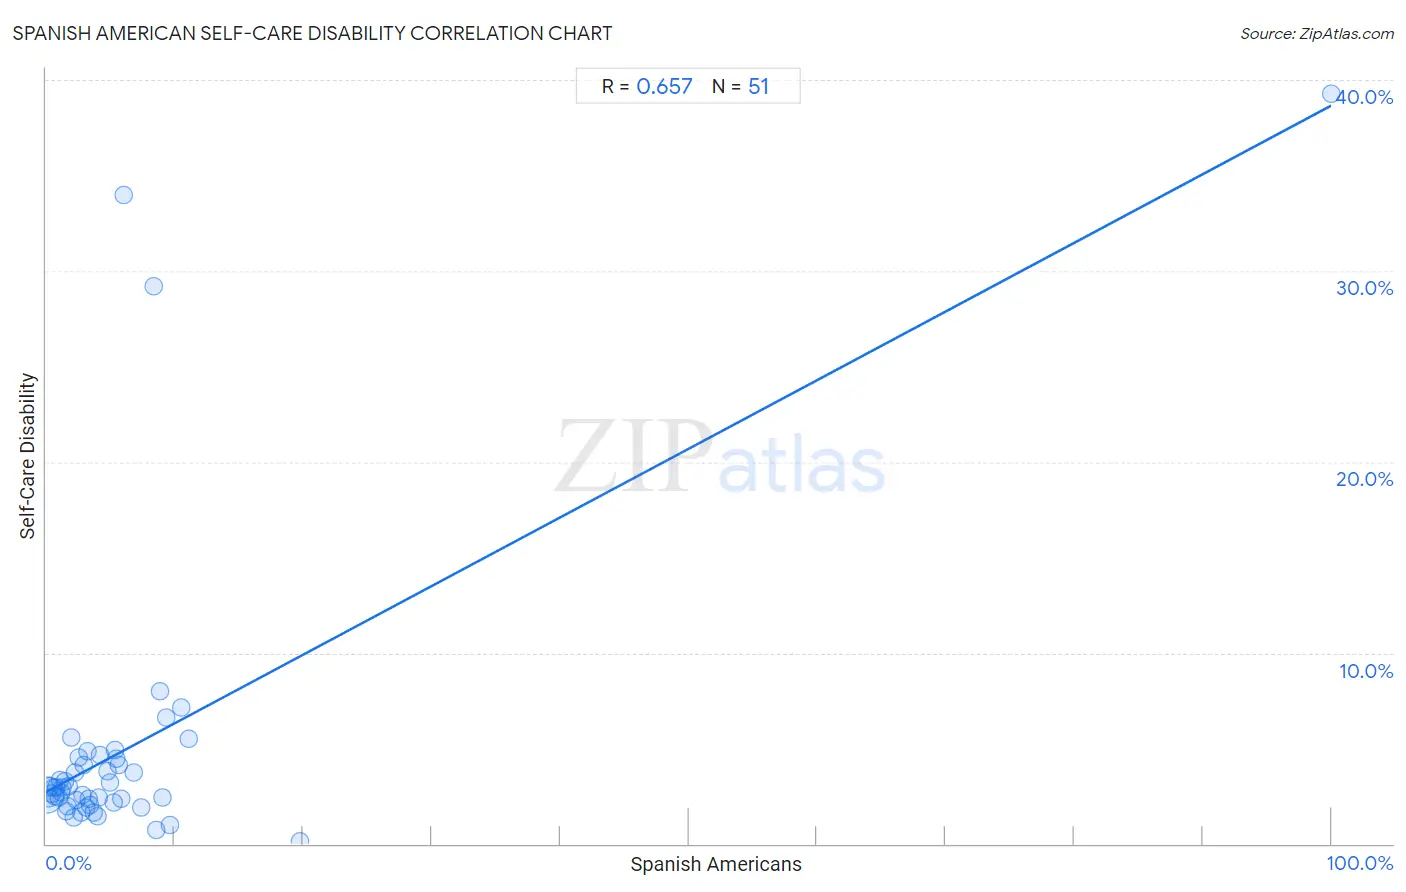
It is essential to understand that the correlation between the percentage of Spanish Americans and percentage of population with self-care disability does not imply a direct cause-and-effect relationship. It remains uncertain whether the presence of Spanish Americans influences an upward or downward trend in the level of percentage of population with self-care disability within an area, or if Spanish Americans simply ended up residing in those areas with higher or lower levels of percentage of population with self-care disability due to other factors.
Demographics Similar to Spanish Americans by Self-Care Disability
In terms of self-care disability, the demographic groups most similar to Spanish Americans are Immigrants from Caribbean (2.8%, a difference of 0.030%), Creek (2.8%, a difference of 0.22%), Puget Sound Salish (2.8%, a difference of 0.23%), British West Indian (2.8%, a difference of 0.30%), and Bangladeshi (2.8%, a difference of 0.40%).
| Demographics | Rating | Rank | Self-Care Disability |
| Aleuts | 0.0 /100 | #306 | Tragic 2.8% |
| Natives/Alaskans | 0.0 /100 | #307 | Tragic 2.8% |
| Immigrants from Grenada | 0.0 /100 | #308 | Tragic 2.8% |
| Bangladeshis | 0.0 /100 | #309 | Tragic 2.8% |
| British West Indians | 0.0 /100 | #310 | Tragic 2.8% |
| Puget Sound Salish | 0.0 /100 | #311 | Tragic 2.8% |
| Immigrants from Caribbean | 0.0 /100 | #312 | Tragic 2.8% |
| Spanish Americans | 0.0 /100 | #313 | Tragic 2.8% |
| Creek | 0.0 /100 | #314 | Tragic 2.8% |
| Immigrants from Cuba | 0.0 /100 | #315 | Tragic 2.8% |
| Menominee | 0.0 /100 | #316 | Tragic 2.8% |
| Immigrants from Dominica | 0.0 /100 | #317 | Tragic 2.8% |
| Assyrians/Chaldeans/Syriacs | 0.0 /100 | #318 | Tragic 2.8% |
| Spanish American Indians | 0.0 /100 | #319 | Tragic 2.9% |
| Chickasaw | 0.0 /100 | #320 | Tragic 2.9% |
Spanish American Self-Care Disability Correlation Summary
| Measurement | Spanish American Data | Self-Care Disability Data |
| Minimum | 0.023% | 0.12% |
| Maximum | 100.0% | 39.3% |
| Range | 100.0% | 39.1% |
| Mean | 6.2% | 4.9% |
| Median | 3.3% | 2.9% |
| Interquartile 25% (IQ1) | 1.6% | 2.2% |
| Interquartile 75% (IQ3) | 6.1% | 4.4% |
| Interquartile Range (IQR) | 4.5% | 2.3% |
| Standard Deviation (Sample) | 13.9% | 7.6% |
| Standard Deviation (Population) | 13.8% | 7.5% |
Correlation Details
| Spanish American Percentile | Sample Size | Self-Care Disability |
[ 0.0% - 0.5% ] 0.023% | 92,626,671 | 2.5% |
[ 0.0% - 0.5% ] 0.17% | 5,507,525 | 2.4% |
[ 0.0% - 0.5% ] 0.31% | 1,685,599 | 3.0% |
[ 0.0% - 0.5% ] 0.44% | 1,672,122 | 2.6% |
[ 0.5% - 1.0% ] 0.55% | 466,216 | 2.9% |
[ 0.5% - 1.0% ] 0.68% | 294,802 | 2.5% |
[ 0.5% - 1.0% ] 0.80% | 224,873 | 3.0% |
[ 0.5% - 1.0% ] 0.95% | 73,627 | 2.4% |
[ 1.0% - 1.5% ] 1.05% | 168,678 | 3.3% |
[ 1.0% - 1.5% ] 1.21% | 110,379 | 2.7% |
[ 1.0% - 1.5% ] 1.31% | 45,172 | 2.9% |
[ 1.0% - 1.5% ] 1.43% | 63,242 | 3.3% |
[ 1.5% - 2.0% ] 1.59% | 38,705 | 1.7% |
[ 1.5% - 2.0% ] 1.69% | 10,890 | 2.0% |
[ 1.5% - 2.0% ] 1.78% | 23,474 | 3.0% |
[ 1.5% - 2.0% ] 1.94% | 2,266 | 5.6% |
[ 2.0% - 2.5% ] 2.09% | 13,673 | 1.3% |
[ 2.0% - 2.5% ] 2.21% | 15,548 | 3.8% |
[ 2.0% - 2.5% ] 2.32% | 11,056 | 2.3% |
[ 2.5% - 3.0% ] 2.58% | 9,165 | 4.5% |
[ 2.5% - 3.0% ] 2.75% | 1,019 | 1.6% |
[ 2.5% - 3.0% ] 2.82% | 7,866 | 2.6% |
[ 2.5% - 3.0% ] 2.96% | 5,571 | 4.1% |
[ 3.0% - 3.5% ] 3.11% | 7,203 | 1.9% |
[ 3.0% - 3.5% ] 3.16% | 411 | 4.9% |
[ 3.0% - 3.5% ] 3.29% | 4,136 | 2.3% |
[ 3.0% - 3.5% ] 3.44% | 6,781 | 2.1% |
[ 3.5% - 4.0% ] 3.69% | 461 | 1.6% |
[ 3.5% - 4.0% ] 3.99% | 3,485 | 1.5% |
[ 4.0% - 4.5% ] 4.05% | 4,347 | 2.4% |
[ 4.0% - 4.5% ] 4.20% | 1,953 | 4.7% |
[ 4.5% - 5.0% ] 4.77% | 902 | 3.8% |
[ 5.0% - 5.5% ] 5.00% | 1,639 | 3.2% |
[ 5.0% - 5.5% ] 5.21% | 2,398 | 2.2% |
[ 5.0% - 5.5% ] 5.33% | 1,501 | 4.9% |
[ 5.0% - 5.5% ] 5.42% | 4,224 | 4.4% |
[ 5.5% - 6.0% ] 5.65% | 2,955 | 4.1% |
[ 5.5% - 6.0% ] 5.86% | 5,156 | 2.3% |
[ 6.0% - 6.5% ] 6.08% | 971 | 34.0% |
[ 6.5% - 7.0% ] 6.84% | 3,217 | 3.8% |
[ 7.0% - 7.5% ] 7.39% | 1,381 | 1.9% |
[ 8.0% - 8.5% ] 8.33% | 24 | 29.2% |
[ 8.5% - 9.0% ] 8.54% | 984 | 0.71% |
[ 8.5% - 9.0% ] 8.83% | 634 | 8.0% |
[ 9.0% - 9.5% ] 9.09% | 2,806 | 2.4% |
[ 9.0% - 9.5% ] 9.33% | 2,445 | 6.6% |
[ 9.5% - 10.0% ] 9.65% | 228 | 1.0% |
[ 10.0% - 10.5% ] 10.46% | 2,179 | 7.1% |
[ 11.0% - 11.5% ] 11.06% | 235 | 5.5% |
[ 19.5% - 20.0% ] 19.79% | 1,950 | 0.12% |
[ 99.5% - 100.0% ] 100.00% | 214 | 39.3% |