Scotch-Irish Single Father Poverty

COMPARE

Scotch-Irish
Race
Ancestry
AfghanAfricanAlaska NativeAlaskan AthabascanAlbanianAleutAlsatianAmericanApacheArabArapahoArgentineanArmenianAssyrian/Chaldean/SyriacAustralianAustrianBahamianBangladeshiBarbadianBasqueBelgianBelizeanBermudanBhutaneseBlackfeetBolivianBrazilianBritishBritish West IndianBulgarianBurmeseCajunCambodianCanadianCape VerdeanCarpatho RusynCelticCentral AmericanCentral American IndianCherokeeCheyenneChickasawChileanChineseChippewaChoctawColombianColvilleComancheCosta RicanCreeCreekCroatianCrowCubanCypriotCzechCzechoslovakianDanishDelawareDominicanDutchDutch West IndianEastern EuropeanEcuadorianEgyptianEnglishEstonianEthiopianEuropeanFijianFilipinoFinnishFrenchFrench American IndianFrench CanadianGermanGerman RussianGhanaianGreekGuamanian/ChamorroGuatemalanGuyaneseHaitianHmongHonduranHopiHoumaHungarianIcelanderIndian (Asian)IndonesianInupiatIranianIraqiIrishIroquoisIsraeliItalianJamaicanJapaneseJordanianKenyanKiowaKoreanLaotianLatvianLebaneseLiberianLithuanianLumbeeLuxembourgerMacedonianMalaysianMalteseMarshalleseMenomineeMexicanMexican American IndianMongolianMoroccanNative HawaiianNavajoNepaleseNew ZealanderNicaraguanNigerianNorthern EuropeanNorwegianOkinawanOsageOttawaPaiutePakistaniPalestinianPanamanianParaguayanPennsylvania GermanPeruvianPimaPolishPortuguesePotawatomiPuebloPuerto RicanPuget Sound SalishRomanianRussianSalvadoranSamoanScandinavianScotch-IrishScottishSeminoleSenegaleseSerbianShoshoneSierra LeoneanSiouxSlavicSlovakSloveneSomaliSouth AfricanSouth AmericanSouth American IndianSoviet UnionSpaniardSpanishSpanish AmericanSpanish American IndianSri LankanSubsaharan AfricanSudaneseSwedishSwissSyrianTaiwaneseThaiTlingit-HaidaTohono O'OdhamTonganTrinidadian and TobagonianTsimshianTurkishU.S. Virgin IslanderUgandanUkrainianUruguayanUteVenezuelanVietnameseWelshWest IndianYakamaYaquiYugoslavianYumanYup'ikZimbabwean
Immigration
NonimmigrantsImmigrantsAfghanistanAfricaAlbaniaArgentinaArmeniaAsiaAustraliaAustriaBahamasBangladeshBarbadosBelarusBelgiumBelizeBoliviaBosnia and HerzegovinaBrazilBulgariaBurma/MyanmarCabo VerdeCambodiaCameroonCanadaCaribbeanCentral AmericaChileChinaColombiaCongoCosta RicaCroatiaCubaCzechoslovakiaDenmarkDominicaDominican RepublicEastern AfricaEastern AsiaEastern EuropeEcuadorEgyptEl SalvadorEnglandEritreaEthiopiaEuropeFijiFranceGermanyGhanaGreeceGrenadaGuatemalaGuyanaHaitiHondurasHong KongHungaryIndiaIndonesiaIranIraqIrelandIsraelItalyJamaicaJapanJordanKazakhstanKenyaKoreaKuwaitLaosLatin AmericaLatviaLebanonLiberiaLithuaniaMalaysiaMexicoMicronesiaMiddle AfricaMoldovaMoroccoNepalNetherlandsNicaraguaNigeriaNorth AmericaNorth MacedoniaNorthern AfricaNorthern EuropeNorwayOceaniaPakistanPanamaPeruPhilippinesPolandPortugalRomaniaRussiaSaudi ArabiaScotlandSenegalSerbiaSierra LeoneSingaporeSomaliaSouth AfricaSouth AmericaSouth Central AsiaSouth Eastern AsiaSouthern EuropeSpainSri LankaSt. Vincent and the GrenadinesSudanSwedenSwitzerlandSyriaTaiwanThailandTrinidad and TobagoTurkeyUgandaUkraineUruguayUzbekistanVenezuelaVietnamWest IndiesWestern AfricaWestern AsiaWestern EuropeYemenZaireZimbabweAzores
Select to Compare
Race
Ancestry
AfghanAfricanAlaska NativeAlaskan AthabascanAlbanianAleutAlsatianAmericanApacheArabArapahoArgentineanArmenianAssyrian/Chaldean/SyriacAustralianAustrianBahamianBangladeshiBarbadianBasqueBelgianBelizeanBermudanBhutaneseBlackfeetBolivianBrazilianBritishBritish West IndianBulgarianBurmeseCajunCambodianCanadianCape VerdeanCarpatho RusynCelticCentral AmericanCentral American IndianCherokeeCheyenneChickasawChileanChineseChippewaChoctawColombianColvilleComancheCosta RicanCreeCreekCroatianCrowCubanCypriotCzechCzechoslovakianDanishDelawareDominicanDutchDutch West IndianEastern EuropeanEcuadorianEgyptianEnglishEstonianEthiopianEuropeanFijianFilipinoFinnishFrenchFrench American IndianFrench CanadianGermanGerman RussianGhanaianGreekGuamanian/ChamorroGuatemalanGuyaneseHaitianHmongHonduranHopiHoumaHungarianIcelanderIndian (Asian)IndonesianInupiatIranianIraqiIrishIroquoisIsraeliItalianJamaicanJapaneseJordanianKenyanKiowaKoreanLaotianLatvianLebaneseLiberianLithuanianLumbeeLuxembourgerMacedonianMalaysianMalteseMarshalleseMenomineeMexicanMexican American IndianMongolianMoroccanNative HawaiianNavajoNepaleseNew ZealanderNicaraguanNigerianNorthern EuropeanNorwegianOkinawanOsageOttawaPaiutePakistaniPalestinianPanamanianParaguayanPennsylvania GermanPeruvianPimaPolishPortuguesePotawatomiPuebloPuerto RicanPuget Sound SalishRomanianRussianSalvadoranSamoanScandinavianScottishSeminoleSenegaleseSerbianShoshoneSierra LeoneanSiouxSlavicSlovakSloveneSomaliSouth AfricanSouth AmericanSouth American IndianSoviet UnionSpaniardSpanishSpanish AmericanSpanish American IndianSri LankanSubsaharan AfricanSudaneseSwedishSwissSyrianTaiwaneseThaiTlingit-HaidaTohono O'OdhamTonganTrinidadian and TobagonianTsimshianTurkishU.S. Virgin IslanderUgandanUkrainianUruguayanUteVenezuelanVietnameseWelshWest IndianYakamaYaquiYugoslavianYumanYup'ikZimbabwean
Immigration
NonimmigrantsImmigrantsAfghanistanAfricaAlbaniaArgentinaArmeniaAsiaAustraliaAustriaBahamasBangladeshBarbadosBelarusBelgiumBelizeBoliviaBosnia and HerzegovinaBrazilBulgariaBurma/MyanmarCabo VerdeCambodiaCameroonCanadaCaribbeanCentral AmericaChileChinaColombiaCongoCosta RicaCroatiaCubaCzechoslovakiaDenmarkDominicaDominican RepublicEastern AfricaEastern AsiaEastern EuropeEcuadorEgyptEl SalvadorEnglandEritreaEthiopiaEuropeFijiFranceGermanyGhanaGreeceGrenadaGuatemalaGuyanaHaitiHondurasHong KongHungaryIndiaIndonesiaIranIraqIrelandIsraelItalyJamaicaJapanJordanKazakhstanKenyaKoreaKuwaitLaosLatin AmericaLatviaLebanonLiberiaLithuaniaMalaysiaMexicoMicronesiaMiddle AfricaMoldovaMoroccoNepalNetherlandsNicaraguaNigeriaNorth AmericaNorth MacedoniaNorthern AfricaNorthern EuropeNorwayOceaniaPakistanPanamaPeruPhilippinesPolandPortugalRomaniaRussiaSaudi ArabiaScotlandSenegalSerbiaSierra LeoneSingaporeSomaliaSouth AfricaSouth AmericaSouth Central AsiaSouth Eastern AsiaSouthern EuropeSpainSri LankaSt. Vincent and the GrenadinesSudanSwedenSwitzerlandSyriaTaiwanThailandTrinidad and TobagoTurkeyUgandaUkraineUruguayUzbekistanVenezuelaVietnamWest IndiesWestern AfricaWestern AsiaWestern EuropeYemenZaireZimbabweAzores
Single Father Poverty
Income
Poverty
Unemployment
Labor Participation
Family Structure
Vehicle Availability
Education Level
Disability

Scotch-Irish Single Father Poverty
Tragic

18.6%
POVERTY | SINGLE FATHERS
0.0/ 100
METRIC RATING
306th/ 347
METRIC RANK

Scotch-Irish Single Father Poverty Correlation Chart

The statistical analysis conducted on geographies consisting of 395,393,443 people shows a strong positive correlation between the proportion of Scotch-Irish and poverty level among single fathers in the United States with a correlation coefficient (R) of 0.730 and weighted average of 18.6%. On average, for every 1% (one percent) increase in Scotch-Irish within a typical geography, there is an increase of 3.1% in poverty level among single fathers.
Scotch-Irish Single Father Poverty
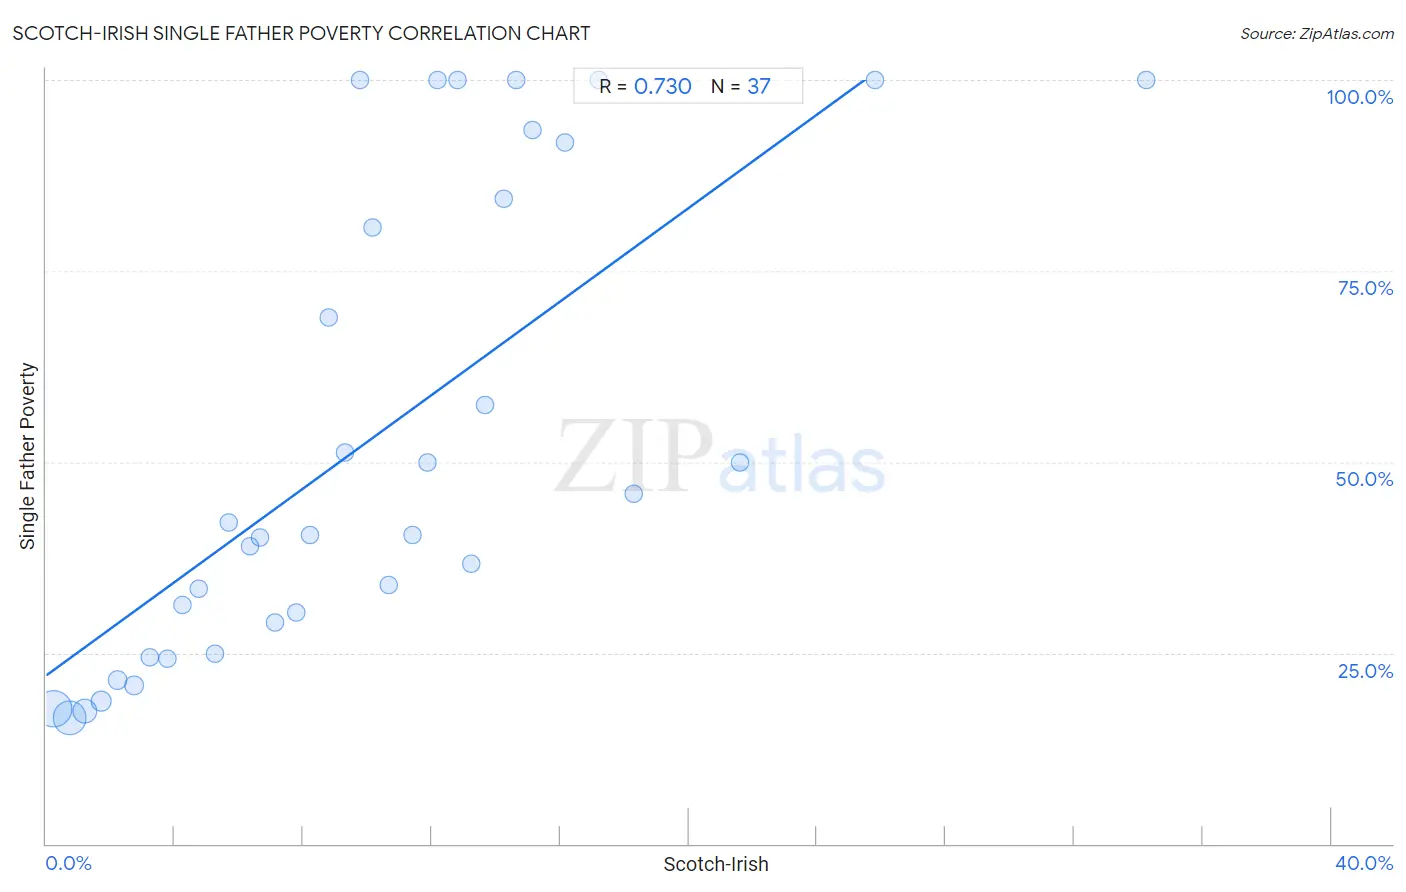
It is essential to understand that the correlation between the percentage of Scotch-Irish and poverty level among single fathers does not imply a direct cause-and-effect relationship. It remains uncertain whether the presence of Scotch-Irish influences an upward or downward trend in the level of poverty level among single fathers within an area, or if Scotch-Irish simply ended up residing in those areas with higher or lower levels of poverty level among single fathers due to other factors.

Demographics Similar to Scotch-Irish by Single Father Poverty

In terms of single father poverty, the demographic groups most similar to Scotch-Irish are French Canadian (18.6%, a difference of 0.040%), Ottawa (18.6%, a difference of 0.060%), Immigrants from Micronesia (18.6%, a difference of 0.17%), Blackfeet (18.5%, a difference of 0.22%), and Ute (18.5%, a difference of 0.27%).
DemographicsRating | RankSingle Father Poverty
Whites/Caucasians
0.0
/100
|
#299
Tragic
18.4%
Immigrants from Dominican Republic
0.0
/100
|
#300
Tragic
18.4%
Hungarians
0.0
/100
|
#301
Tragic
18.5%
Comanche
0.0
/100
|
#302
Tragic
18.5%
Celtics
0.0
/100
|
#303
Tragic
18.5%
Ute
0.0
/100
|
#304
Tragic
18.5%
Blackfeet
0.0
/100
|
#305
Tragic
18.5%
Scotch-Irish
0.0
/100
|
#306
Tragic
18.6%
French Canadians
0.0
/100
|
#307
Tragic
18.6%
Ottawa
0.0
/100
|
#308
Tragic
18.6%
Immigrants from Micronesia
0.0
/100
|
#309
Tragic
18.6%
Chippewa
0.0
/100
|
#310
Tragic
18.8%
Nonimmigrants
0.0
/100
|
#311
Tragic
18.8%
Immigrants from Dominica
0.0
/100
|
#312
Tragic
18.9%
Potawatomi
0.0
/100
|
#313
Tragic
18.9%

Scotch-Irish Single Father Poverty Correlation Summary

MeasurementScotch-Irish DataSingle Father Poverty Data
Minimum0.25%16.5%
Maximum34.2%100.0%
Range34.0%83.5%
Mean10.1%52.9%
Median9.3%40.5%
Interquartile 25% (IQ1)4.5%27.0%
Interquartile 75% (IQ3)14.0%88.2%
Interquartile Range (IQR)9.5%61.2%
Standard Deviation (Sample)7.3%30.5%
Standard Deviation (Population)7.2%30.1%

Correlation Details

Scotch-Irish PercentileSample SizeSingle Father Poverty
[
0.0%
-
0.5%
]
0.25%
161,493,33517.7%
[
0.5%
-
1.0%
]
0.72%
134,524,05716.5%
[
1.0%
-
1.5%
]
1.20%
56,563,18117.4%
[
1.5%
-
2.0%
]
1.71%
23,405,34618.7%
[
2.0%
-
2.5%
]
2.21%
9,393,06121.5%
[
2.5%
-
3.0%
]
2.74%
4,300,51420.7%
[
3.0%
-
3.5%
]
3.23%
2,885,43624.4%
[
3.5%
-
4.0%
]
3.76%
1,345,12424.3%
[
4.0%
-
4.5%
]
4.23%
609,54831.3%
[
4.5%
-
5.0%
]
4.75%
228,38033.3%
[
5.0%
-
5.5%
]
5.24%
295,31124.9%
[
5.5%
-
6.0%
]
5.70%
127,12642.1%
[
6.0%
-
6.5%
]
6.33%
36,18339.0%
[
6.5%
-
7.0%
]
6.64%
33,41040.1%
[
7.0%
-
7.5%
]
7.12%
22,92229.0%
[
7.5%
-
8.0%
]
7.78%
28,40330.2%
[
8.0%
-
8.5%
]
8.20%
13,38540.5%
[
8.5%
-
9.0%
]
8.78%
19,54968.9%
[
9.0%
-
9.5%
]
9.29%
4,81151.2%
[
9.5%
-
10.0%
]
9.77%
921100.0%
[
10.0%
-
10.5%
]
10.15%
3,35080.6%
[
10.5%
-
11.0%
]
10.66%
11,91933.9%
[
11.0%
-
11.5%
]
11.38%
1,46740.5%
[
11.5%
-
12.0%
]
11.88%
2,90550.0%
[
12.0%
-
12.5%
]
12.17%
1,438100.0%
[
12.5%
-
13.0%
]
12.80%
422100.0%
[
13.0%
-
13.5%
]
13.23%
14,10636.7%
[
13.5%
-
14.0%
]
13.67%
7,11857.4%
[
14.0%
-
14.5%
]
14.24%
11,93484.5%
[
14.5%
-
15.0%
]
14.63%
82100.0%
[
15.0%
-
15.5%
]
15.12%
2,18993.5%
[
16.0%
-
16.5%
]
16.14%
3,40791.8%
[
17.0%
-
17.5%
]
17.21%
761100.0%
[
18.0%
-
18.5%
]
18.27%
1,28645.8%
[
21.5%
-
22.0%
]
21.61%
19950.0%
[
25.5%
-
26.0%
]
25.80%
407100.0%
[
34.0%
-
34.5%
]
34.22%
450100.0%