Scotch-Irish No Schooling Completed
COMPARE
Scotch-Irish
Select to Compare
No Schooling Completed
Scotch-Irish No Schooling Completed
1.5%
NO SCHOOLING
100.0/ 100
METRIC RATING
14th/ 347
METRIC RANK
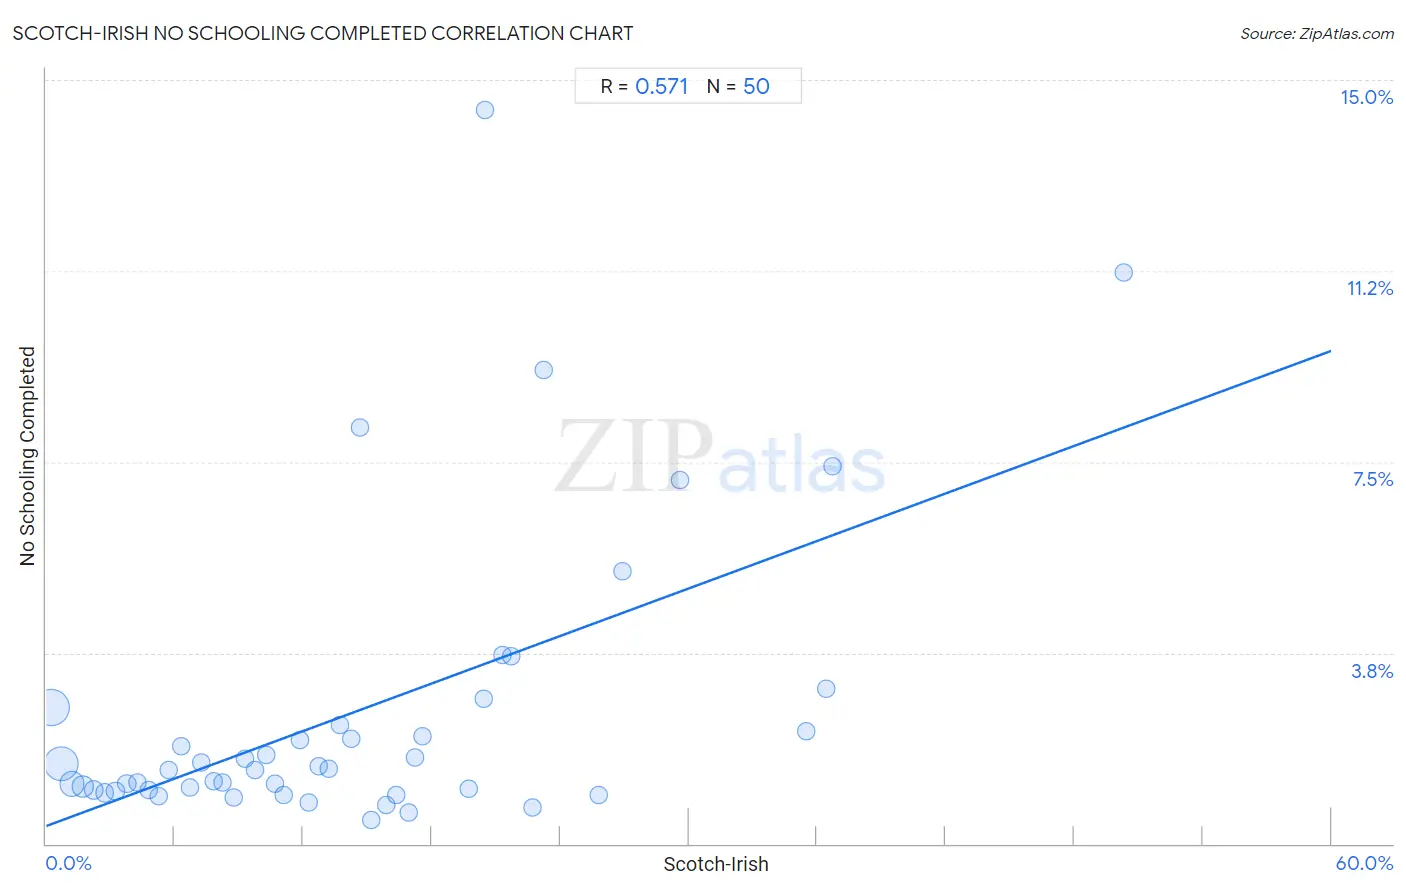
Scotch-Irish No Schooling Completed Correlation Chart
The statistical analysis conducted on geographies consisting of 532,641,930 people shows a substantial positive correlation between the proportion of Scotch-Irish and percentage of population with no schooling in the United States with a correlation coefficient (R) of 0.571 and weighted average of 1.5%. On average, for every 1% (one percent) increase in Scotch-Irish within a typical geography, there is an increase of 0.16% in percentage of population with no schooling.
It is essential to understand that the correlation between the percentage of Scotch-Irish and percentage of population with no schooling does not imply a direct cause-and-effect relationship. It remains uncertain whether the presence of Scotch-Irish influences an upward or downward trend in the level of percentage of population with no schooling within an area, or if Scotch-Irish simply ended up residing in those areas with higher or lower levels of percentage of population with no schooling due to other factors.
Demographics Similar to Scotch-Irish by No Schooling Completed
In terms of no schooling completed, the demographic groups most similar to Scotch-Irish are Tlingit-Haida (1.5%, a difference of 0.060%), Finnish (1.5%, a difference of 0.58%), Croatian (1.5%, a difference of 0.59%), Danish (1.5%, a difference of 0.89%), and Polish (1.4%, a difference of 0.94%).
| Demographics | Rating | Rank | No Schooling Completed |
| English | 100.0 /100 | #7 | Exceptional 1.4% |
| Swedes | 100.0 /100 | #8 | Exceptional 1.4% |
| Scottish | 100.0 /100 | #9 | Exceptional 1.4% |
| Dutch | 100.0 /100 | #10 | Exceptional 1.4% |
| Lithuanians | 100.0 /100 | #11 | Exceptional 1.4% |
| Irish | 100.0 /100 | #12 | Exceptional 1.4% |
| Poles | 100.0 /100 | #13 | Exceptional 1.4% |
| Scotch-Irish | 100.0 /100 | #14 | Exceptional 1.5% |
| Tlingit-Haida | 100.0 /100 | #15 | Exceptional 1.5% |
| Finns | 100.0 /100 | #16 | Exceptional 1.5% |
| Croatians | 100.0 /100 | #17 | Exceptional 1.5% |
| Danes | 100.0 /100 | #18 | Exceptional 1.5% |
| Alaskan Athabascans | 100.0 /100 | #19 | Exceptional 1.5% |
| Welsh | 100.0 /100 | #20 | Exceptional 1.5% |
| Chinese | 100.0 /100 | #21 | Exceptional 1.5% |
Scotch-Irish No Schooling Completed Correlation Summary
| Measurement | Scotch-Irish Data | No Schooling Completed Data |
| Minimum | 0.25% | 0.46% |
| Maximum | 50.3% | 14.4% |
| Range | 50.1% | 14.0% |
| Mean | 14.3% | 2.6% |
| Median | 12.5% | 1.5% |
| Interquartile 25% (IQ1) | 6.3% | 1.0% |
| Interquartile 75% (IQ3) | 20.5% | 2.3% |
| Interquartile Range (IQR) | 14.1% | 1.3% |
| Standard Deviation (Sample) | 10.7% | 2.9% |
| Standard Deviation (Population) | 10.6% | 2.9% |
Correlation Details
| Scotch-Irish Percentile | Sample Size | No Schooling Completed |
[ 0.0% - 0.5% ] 0.25% | 206,767,092 | 2.7% |
[ 0.5% - 1.0% ] 0.72% | 178,953,520 | 1.6% |
[ 1.0% - 1.5% ] 1.21% | 79,924,916 | 1.2% |
[ 1.5% - 2.0% ] 1.71% | 34,882,253 | 1.1% |
[ 2.0% - 2.5% ] 2.21% | 14,934,914 | 1.1% |
[ 2.5% - 3.0% ] 2.73% | 7,229,977 | 1.0% |
[ 3.0% - 3.5% ] 3.23% | 4,604,401 | 1.0% |
[ 3.5% - 4.0% ] 3.76% | 2,159,756 | 1.2% |
[ 4.0% - 4.5% ] 4.25% | 1,118,815 | 1.2% |
[ 4.5% - 5.0% ] 4.76% | 606,202 | 1.0% |
[ 5.0% - 5.5% ] 5.23% | 579,269 | 0.92% |
[ 5.5% - 6.0% ] 5.71% | 230,630 | 1.5% |
[ 6.0% - 6.5% ] 6.31% | 138,443 | 1.9% |
[ 6.5% - 7.0% ] 6.70% | 103,763 | 1.1% |
[ 7.0% - 7.5% ] 7.22% | 83,106 | 1.6% |
[ 7.5% - 8.0% ] 7.79% | 72,744 | 1.2% |
[ 8.0% - 8.5% ] 8.21% | 43,260 | 1.2% |
[ 8.5% - 9.0% ] 8.74% | 38,030 | 0.91% |
[ 9.0% - 9.5% ] 9.25% | 17,907 | 1.7% |
[ 9.5% - 10.0% ] 9.73% | 25,431 | 1.4% |
[ 10.0% - 10.5% ] 10.28% | 26,909 | 1.7% |
[ 10.5% - 11.0% ] 10.69% | 12,970 | 1.2% |
[ 11.0% - 11.5% ] 11.12% | 7,573 | 0.96% |
[ 11.5% - 12.0% ] 11.85% | 6,423 | 2.0% |
[ 12.0% - 12.5% ] 12.23% | 4,522 | 0.82% |
[ 12.5% - 13.0% ] 12.71% | 2,298 | 1.5% |
[ 13.0% - 13.5% ] 13.21% | 15,631 | 1.5% |
[ 13.5% - 14.0% ] 13.69% | 7,984 | 2.3% |
[ 14.0% - 14.5% ] 14.25% | 13,343 | 2.1% |
[ 14.5% - 15.0% ] 14.63% | 164 | 8.2% |
[ 15.0% - 15.5% ] 15.18% | 3,030 | 0.46% |
[ 15.5% - 16.0% ] 15.89% | 3,681 | 0.76% |
[ 16.0% - 16.5% ] 16.33% | 3,736 | 0.97% |
[ 16.5% - 17.0% ] 16.91% | 2,424 | 0.62% |
[ 17.0% - 17.5% ] 17.21% | 4,353 | 1.7% |
[ 17.5% - 18.0% ] 17.60% | 7,075 | 2.1% |
[ 19.5% - 20.0% ] 19.71% | 974 | 1.1% |
[ 20.0% - 20.5% ] 20.45% | 44 | 2.9% |
[ 20.5% - 21.0% ] 20.51% | 117 | 14.4% |
[ 21.0% - 21.5% ] 21.32% | 577 | 3.7% |
[ 21.5% - 22.0% ] 21.73% | 962 | 3.7% |
[ 22.5% - 23.0% ] 22.68% | 732 | 0.72% |
[ 23.0% - 23.5% ] 23.26% | 43 | 9.3% |
[ 25.5% - 26.0% ] 25.80% | 407 | 0.95% |
[ 26.5% - 27.0% ] 26.92% | 364 | 5.4% |
[ 29.5% - 30.0% ] 29.59% | 98 | 7.1% |
[ 35.0% - 35.5% ] 35.46% | 141 | 2.2% |
[ 36.0% - 36.5% ] 36.40% | 728 | 3.1% |
[ 36.5% - 37.0% ] 36.73% | 49 | 7.4% |
[ 50.0% - 50.5% ] 50.34% | 149 | 11.2% |