Uruguayan Self-Care Disability
COMPARE
Uruguayan
Select to Compare
Self-Care Disability
Uruguayan Self-Care Disability
2.4%
SELF-CARE DISABILITY
91.5/ 100
METRIC RATING
120th/ 347
METRIC RANK
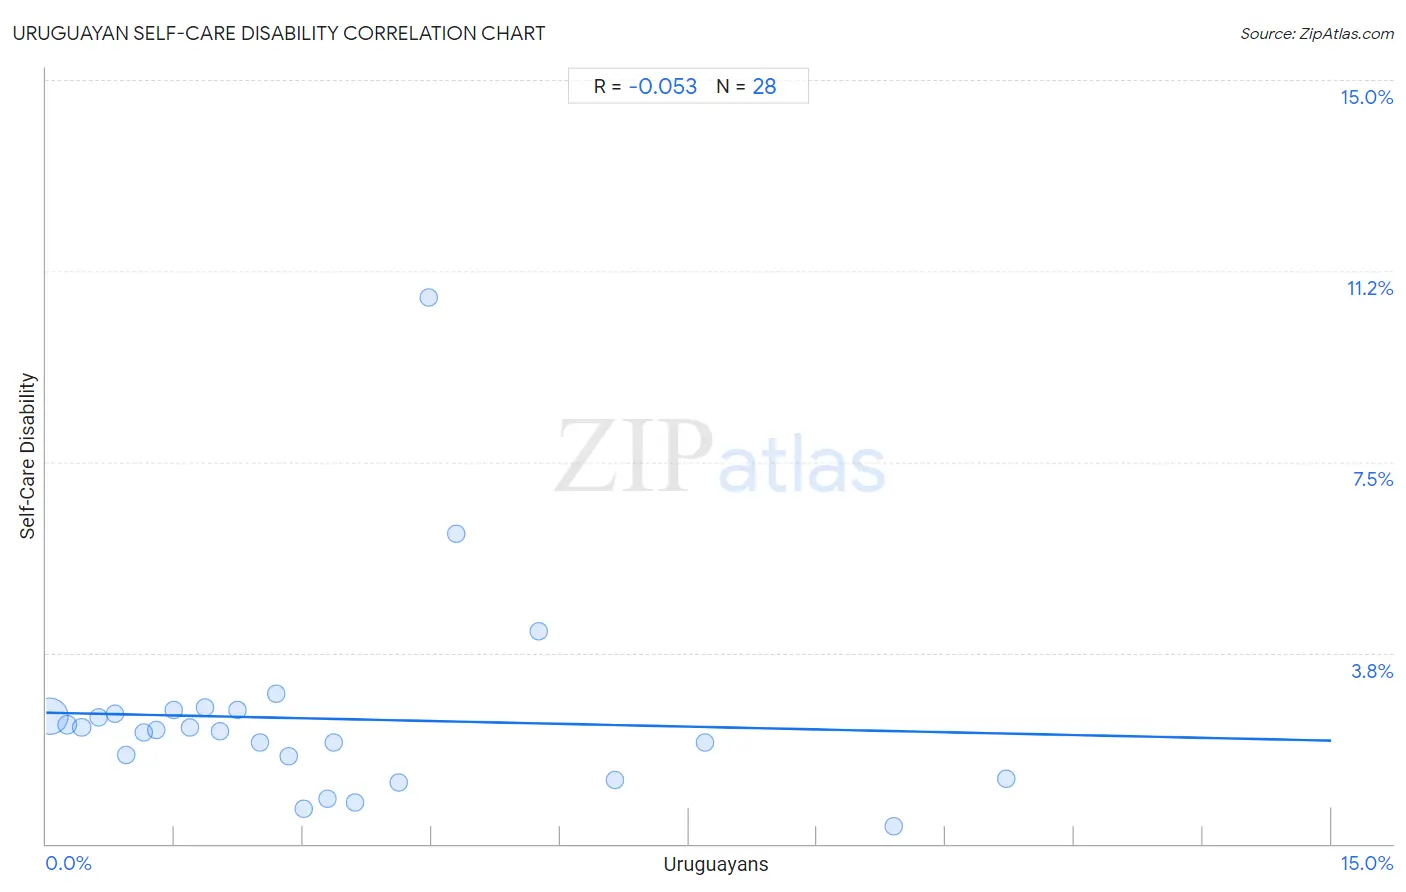
Uruguayan Self-Care Disability Correlation Chart
The statistical analysis conducted on geographies consisting of 144,751,160 people shows a slight negative correlation between the proportion of Uruguayans and percentage of population with self-care disability in the United States with a correlation coefficient (R) of -0.053 and weighted average of 2.4%. On average, for every 1% (one percent) increase in Uruguayans within a typical geography, there is a decrease of 0.037% in percentage of population with self-care disability.
It is essential to understand that the correlation between the percentage of Uruguayans and percentage of population with self-care disability does not imply a direct cause-and-effect relationship. It remains uncertain whether the presence of Uruguayans influences an upward or downward trend in the level of percentage of population with self-care disability within an area, or if Uruguayans simply ended up residing in those areas with higher or lower levels of percentage of population with self-care disability due to other factors.
Demographics Similar to Uruguayans by Self-Care Disability
In terms of self-care disability, the demographic groups most similar to Uruguayans are Peruvian (2.4%, a difference of 0.030%), Immigrants from Sierra Leone (2.4%, a difference of 0.050%), Immigrants from Canada (2.4%, a difference of 0.080%), Belgian (2.4%, a difference of 0.10%), and Taiwanese (2.4%, a difference of 0.17%).
| Demographics | Rating | Rank | Self-Care Disability |
| South Americans | 93.2 /100 | #113 | Exceptional 2.4% |
| Immigrants from North Macedonia | 93.1 /100 | #114 | Exceptional 2.4% |
| Immigrants from Hong Kong | 93.1 /100 | #115 | Exceptional 2.4% |
| Northern Europeans | 92.9 /100 | #116 | Exceptional 2.4% |
| Taiwanese | 92.5 /100 | #117 | Exceptional 2.4% |
| Immigrants from Canada | 92.0 /100 | #118 | Exceptional 2.4% |
| Immigrants from Sierra Leone | 91.8 /100 | #119 | Exceptional 2.4% |
| Uruguayans | 91.5 /100 | #120 | Exceptional 2.4% |
| Peruvians | 91.3 /100 | #121 | Exceptional 2.4% |
| Belgians | 90.9 /100 | #122 | Exceptional 2.4% |
| Immigrants from Nigeria | 90.3 /100 | #123 | Exceptional 2.4% |
| Immigrants from North America | 90.2 /100 | #124 | Exceptional 2.4% |
| Immigrants from Morocco | 90.2 /100 | #124 | Exceptional 2.4% |
| Hmong | 89.9 /100 | #126 | Excellent 2.4% |
| Colombians | 89.7 /100 | #127 | Excellent 2.4% |
Uruguayan Self-Care Disability Correlation Summary
| Measurement | Uruguayan Data | Self-Care Disability Data |
| Minimum | 0.040% | 0.33% |
| Maximum | 11.2% | 10.7% |
| Range | 11.2% | 10.4% |
| Mean | 3.2% | 2.5% |
| Median | 2.6% | 2.2% |
| Interquartile 25% (IQ1) | 1.2% | 1.5% |
| Interquartile 75% (IQ3) | 4.3% | 2.6% |
| Interquartile Range (IQR) | 3.1% | 1.1% |
| Standard Deviation (Sample) | 2.8% | 2.0% |
| Standard Deviation (Population) | 2.8% | 1.9% |
Correlation Details
| Uruguayan Percentile | Sample Size | Self-Care Disability |
[ 0.0% - 0.5% ] 0.040% | 126,087,399 | 2.5% |
[ 0.0% - 0.5% ] 0.25% | 11,783,211 | 2.3% |
[ 0.0% - 0.5% ] 0.42% | 2,735,443 | 2.3% |
[ 0.5% - 1.0% ] 0.61% | 1,673,075 | 2.5% |
[ 0.5% - 1.0% ] 0.80% | 874,513 | 2.5% |
[ 0.5% - 1.0% ] 0.94% | 519,332 | 1.7% |
[ 1.0% - 1.5% ] 1.13% | 220,616 | 2.2% |
[ 1.0% - 1.5% ] 1.29% | 257,133 | 2.2% |
[ 1.0% - 1.5% ] 1.48% | 237,582 | 2.6% |
[ 1.5% - 2.0% ] 1.67% | 133,798 | 2.3% |
[ 1.5% - 2.0% ] 1.85% | 70,523 | 2.7% |
[ 2.0% - 2.5% ] 2.02% | 52,551 | 2.2% |
[ 2.0% - 2.5% ] 2.23% | 69,004 | 2.6% |
[ 2.0% - 2.5% ] 2.50% | 9,969 | 2.0% |
[ 2.5% - 3.0% ] 2.69% | 1,747 | 2.9% |
[ 2.5% - 3.0% ] 2.83% | 1,659 | 1.7% |
[ 2.5% - 3.0% ] 3.00% | 1,067 | 0.68% |
[ 3.0% - 3.5% ] 3.28% | 1,250 | 0.89% |
[ 3.0% - 3.5% ] 3.36% | 506 | 2.0% |
[ 3.5% - 4.0% ] 3.61% | 887 | 0.80% |
[ 4.0% - 4.5% ] 4.11% | 7,857 | 1.2% |
[ 4.0% - 4.5% ] 4.46% | 830 | 10.7% |
[ 4.5% - 5.0% ] 4.79% | 313 | 6.1% |
[ 5.5% - 6.0% ] 5.75% | 2,367 | 4.2% |
[ 6.5% - 7.0% ] 6.63% | 4,553 | 1.3% |
[ 7.5% - 8.0% ] 7.69% | 611 | 2.0% |
[ 9.5% - 10.0% ] 9.89% | 3,114 | 0.33% |
[ 11.0% - 11.5% ] 11.20% | 250 | 1.3% |