Navajo Self-Care Disability
COMPARE
Navajo
Select to Compare
Self-Care Disability
Navajo Self-Care Disability
2.9%
SELF-CARE DISABILITY
0.0/ 100
METRIC RATING
321st/ 347
METRIC RANK
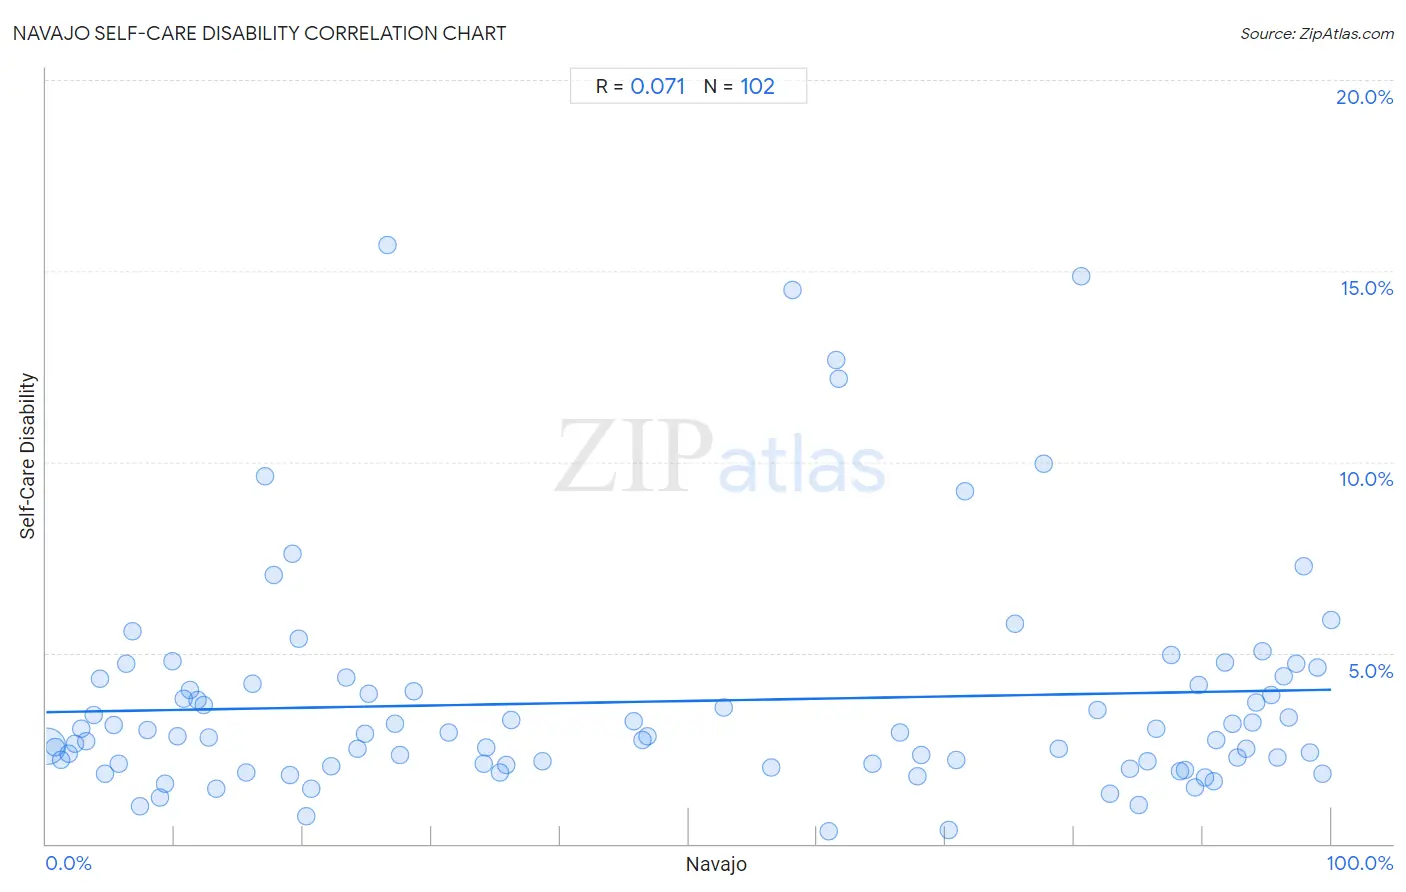
Navajo Self-Care Disability Correlation Chart
The statistical analysis conducted on geographies consisting of 224,543,915 people shows a slight positive correlation between the proportion of Navajo and percentage of population with self-care disability in the United States with a correlation coefficient (R) of 0.071 and weighted average of 2.9%. On average, for every 1% (one percent) increase in Navajo within a typical geography, there is an increase of 0.0059% in percentage of population with self-care disability.
It is essential to understand that the correlation between the percentage of Navajo and percentage of population with self-care disability does not imply a direct cause-and-effect relationship. It remains uncertain whether the presence of Navajo influences an upward or downward trend in the level of percentage of population with self-care disability within an area, or if Navajo simply ended up residing in those areas with higher or lower levels of percentage of population with self-care disability due to other factors.
Demographics Similar to Navajo by Self-Care Disability
In terms of self-care disability, the demographic groups most similar to Navajo are Chickasaw (2.9%, a difference of 0.15%), Comanche (2.9%, a difference of 0.32%), Spanish American Indian (2.9%, a difference of 0.37%), Seminole (2.9%, a difference of 0.45%), and Assyrian/Chaldean/Syriac (2.8%, a difference of 0.52%).
| Demographics | Rating | Rank | Self-Care Disability |
| Creek | 0.0 /100 | #314 | Tragic 2.8% |
| Immigrants from Cuba | 0.0 /100 | #315 | Tragic 2.8% |
| Menominee | 0.0 /100 | #316 | Tragic 2.8% |
| Immigrants from Dominica | 0.0 /100 | #317 | Tragic 2.8% |
| Assyrians/Chaldeans/Syriacs | 0.0 /100 | #318 | Tragic 2.8% |
| Spanish American Indians | 0.0 /100 | #319 | Tragic 2.9% |
| Chickasaw | 0.0 /100 | #320 | Tragic 2.9% |
| Navajo | 0.0 /100 | #321 | Tragic 2.9% |
| Comanche | 0.0 /100 | #322 | Tragic 2.9% |
| Seminole | 0.0 /100 | #323 | Tragic 2.9% |
| Cherokee | 0.0 /100 | #324 | Tragic 2.9% |
| Immigrants from Uzbekistan | 0.0 /100 | #325 | Tragic 2.9% |
| Paiute | 0.0 /100 | #326 | Tragic 2.9% |
| Blacks/African Americans | 0.0 /100 | #327 | Tragic 2.9% |
| Hopi | 0.0 /100 | #328 | Tragic 2.9% |
Navajo Self-Care Disability Correlation Summary
| Measurement | Navajo Data | Self-Care Disability Data |
| Minimum | 0.078% | 0.33% |
| Maximum | 100.0% | 15.7% |
| Range | 99.9% | 15.4% |
| Mean | 48.5% | 3.7% |
| Median | 42.2% | 2.9% |
| Interquartile 25% (IQ1) | 13.2% | 2.1% |
| Interquartile 75% (IQ3) | 86.3% | 4.2% |
| Interquartile Range (IQR) | 73.1% | 2.1% |
| Standard Deviation (Sample) | 35.4% | 3.0% |
| Standard Deviation (Population) | 35.2% | 2.9% |
Correlation Details
| Navajo Percentile | Sample Size | Self-Care Disability |
[ 0.0% - 0.5% ] 0.078% | 208,850,616 | 2.6% |
[ 0.5% - 1.0% ] 0.71% | 7,602,145 | 2.5% |
[ 1.0% - 1.5% ] 1.15% | 4,144,179 | 2.2% |
[ 1.5% - 2.0% ] 1.73% | 987,487 | 2.4% |
[ 2.0% - 2.5% ] 2.23% | 652,104 | 2.6% |
[ 2.5% - 3.0% ] 2.69% | 280,920 | 3.0% |
[ 3.0% - 3.5% ] 3.11% | 770,118 | 2.7% |
[ 3.5% - 4.0% ] 3.73% | 157,122 | 3.4% |
[ 4.0% - 4.5% ] 4.21% | 104,487 | 4.3% |
[ 4.5% - 5.0% ] 4.56% | 38,341 | 1.8% |
[ 5.0% - 5.5% ] 5.22% | 96,378 | 3.1% |
[ 5.5% - 6.0% ] 5.68% | 31,067 | 2.1% |
[ 6.0% - 6.5% ] 6.24% | 9,719 | 4.7% |
[ 6.5% - 7.0% ] 6.75% | 6,948 | 5.6% |
[ 7.0% - 7.5% ] 7.31% | 7,030 | 0.99% |
[ 7.5% - 8.0% ] 7.86% | 40,609 | 3.0% |
[ 8.5% - 9.0% ] 8.82% | 132,895 | 1.2% |
[ 9.0% - 9.5% ] 9.28% | 4,858 | 1.6% |
[ 9.5% - 10.0% ] 9.81% | 19,204 | 4.8% |
[ 10.0% - 10.5% ] 10.23% | 48,472 | 2.8% |
[ 10.5% - 11.0% ] 10.71% | 1,709 | 3.8% |
[ 11.0% - 11.5% ] 11.21% | 9,287 | 4.0% |
[ 11.5% - 12.0% ] 11.73% | 452 | 3.8% |
[ 12.0% - 12.5% ] 12.28% | 13,859 | 3.6% |
[ 12.5% - 13.0% ] 12.67% | 2,652 | 2.8% |
[ 13.0% - 13.5% ] 13.24% | 3,921 | 1.5% |
[ 15.5% - 16.0% ] 15.61% | 6,214 | 1.9% |
[ 16.0% - 16.5% ] 16.03% | 343 | 4.2% |
[ 16.5% - 17.0% ] 16.99% | 359 | 9.6% |
[ 17.5% - 18.0% ] 17.69% | 1,046 | 7.0% |
[ 18.5% - 19.0% ] 18.93% | 7,038 | 1.8% |
[ 19.0% - 19.5% ] 19.17% | 3,229 | 7.6% |
[ 19.5% - 20.0% ] 19.70% | 3,224 | 5.4% |
[ 20.0% - 20.5% ] 20.22% | 10,362 | 0.73% |
[ 20.5% - 21.0% ] 20.59% | 1,093 | 1.4% |
[ 22.0% - 22.5% ] 22.14% | 14,980 | 2.0% |
[ 23.0% - 23.5% ] 23.33% | 583 | 4.3% |
[ 24.0% - 24.5% ] 24.25% | 3,345 | 2.5% |
[ 24.5% - 25.0% ] 24.84% | 7,762 | 2.9% |
[ 25.0% - 25.5% ] 25.12% | 3,308 | 3.9% |
[ 26.5% - 27.0% ] 26.52% | 230 | 15.7% |
[ 27.0% - 27.5% ] 27.16% | 4,834 | 3.1% |
[ 27.5% - 28.0% ] 27.52% | 46,457 | 2.3% |
[ 28.5% - 29.0% ] 28.57% | 4,858 | 4.0% |
[ 31.0% - 31.5% ] 31.29% | 46,398 | 2.9% |
[ 34.0% - 34.5% ] 34.00% | 100 | 2.1% |
[ 34.0% - 34.5% ] 34.25% | 5,317 | 2.5% |
[ 35.0% - 35.5% ] 35.30% | 4,842 | 1.9% |
[ 35.5% - 36.0% ] 35.82% | 8,943 | 2.1% |
[ 36.0% - 36.5% ] 36.17% | 188 | 3.2% |
[ 38.5% - 39.0% ] 38.63% | 1,504 | 2.1% |
[ 45.5% - 46.0% ] 45.72% | 9,175 | 3.2% |
[ 46.0% - 46.5% ] 46.36% | 22,997 | 2.7% |
[ 46.5% - 47.0% ] 46.82% | 22,454 | 2.8% |
[ 52.5% - 53.0% ] 52.68% | 16,651 | 3.6% |
[ 56.0% - 56.5% ] 56.43% | 8,855 | 2.0% |
[ 58.0% - 58.5% ] 58.03% | 193 | 14.5% |
[ 60.5% - 61.0% ] 60.86% | 304 | 0.33% |
[ 61.0% - 61.5% ] 61.48% | 610 | 12.7% |
[ 61.5% - 62.0% ] 61.69% | 2,665 | 12.2% |
[ 64.0% - 64.5% ] 64.27% | 10,785 | 2.1% |
[ 66.0% - 66.5% ] 66.44% | 1,612 | 2.9% |
[ 67.5% - 68.0% ] 67.80% | 1,938 | 1.8% |
[ 68.0% - 68.5% ] 68.13% | 5,600 | 2.3% |
[ 70.0% - 70.5% ] 70.24% | 1,482 | 0.36% |
[ 70.5% - 71.0% ] 70.81% | 1,552 | 2.2% |
[ 71.0% - 71.5% ] 71.50% | 1,607 | 9.2% |
[ 75.0% - 75.5% ] 75.39% | 191 | 5.8% |
[ 77.5% - 78.0% ] 77.65% | 4,345 | 9.9% |
[ 78.5% - 79.0% ] 78.78% | 11,541 | 2.5% |
[ 80.5% - 81.0% ] 80.57% | 211 | 14.9% |
[ 81.5% - 82.0% ] 81.80% | 445 | 3.5% |
[ 82.5% - 83.0% ] 82.74% | 2,653 | 1.3% |
[ 84.0% - 84.5% ] 84.30% | 8,372 | 2.0% |
[ 85.0% - 85.5% ] 85.03% | 2,945 | 1.0% |
[ 85.5% - 86.0% ] 85.71% | 238 | 2.2% |
[ 86.0% - 86.5% ] 86.35% | 967 | 3.0% |
[ 87.5% - 88.0% ] 87.56% | 868 | 4.9% |
[ 88.0% - 88.5% ] 88.28% | 435 | 1.9% |
[ 88.5% - 89.0% ] 88.60% | 7,238 | 1.9% |
[ 89.0% - 89.5% ] 89.40% | 217 | 1.5% |
[ 89.5% - 90.0% ] 89.73% | 867 | 4.1% |
[ 90.0% - 90.5% ] 90.22% | 2,137 | 1.7% |
[ 90.5% - 91.0% ] 90.84% | 11,403 | 1.6% |
[ 91.0% - 91.5% ] 91.07% | 9,234 | 2.7% |
[ 91.5% - 92.0% ] 91.69% | 8,424 | 4.7% |
[ 92.0% - 92.5% ] 92.32% | 8,411 | 3.1% |
[ 92.5% - 93.0% ] 92.75% | 19,851 | 2.3% |
[ 93.0% - 93.5% ] 93.34% | 3,932 | 2.5% |
[ 93.5% - 94.0% ] 93.92% | 8,846 | 3.2% |
[ 94.0% - 94.5% ] 94.20% | 27,550 | 3.7% |
[ 94.5% - 95.0% ] 94.66% | 6,329 | 5.0% |
[ 95.0% - 95.5% ] 95.36% | 13,953 | 3.9% |
[ 95.5% - 96.0% ] 95.82% | 9,064 | 2.3% |
[ 96.0% - 96.5% ] 96.30% | 6,750 | 4.4% |
[ 96.5% - 97.0% ] 96.72% | 16,594 | 3.3% |
[ 97.0% - 97.5% ] 97.25% | 2,729 | 4.7% |
[ 97.5% - 98.0% ] 97.87% | 9,524 | 7.3% |
[ 98.0% - 98.5% ] 98.33% | 3,235 | 2.4% |
[ 98.5% - 99.0% ] 98.90% | 5,369 | 4.6% |
[ 99.0% - 99.5% ] 99.30% | 11,093 | 1.8% |
[ 99.5% - 100.0% ] 100.00% | 6,338 | 5.9% |