Immigrants from Hungary Self-Care Disability
COMPARE
Immigrants from Hungary
Select to Compare
Self-Care Disability
Immigrants from Hungary Self-Care Disability
2.4%
SELF-CARE DISABILITY
89.6/ 100
METRIC RATING
128th/ 347
METRIC RANK
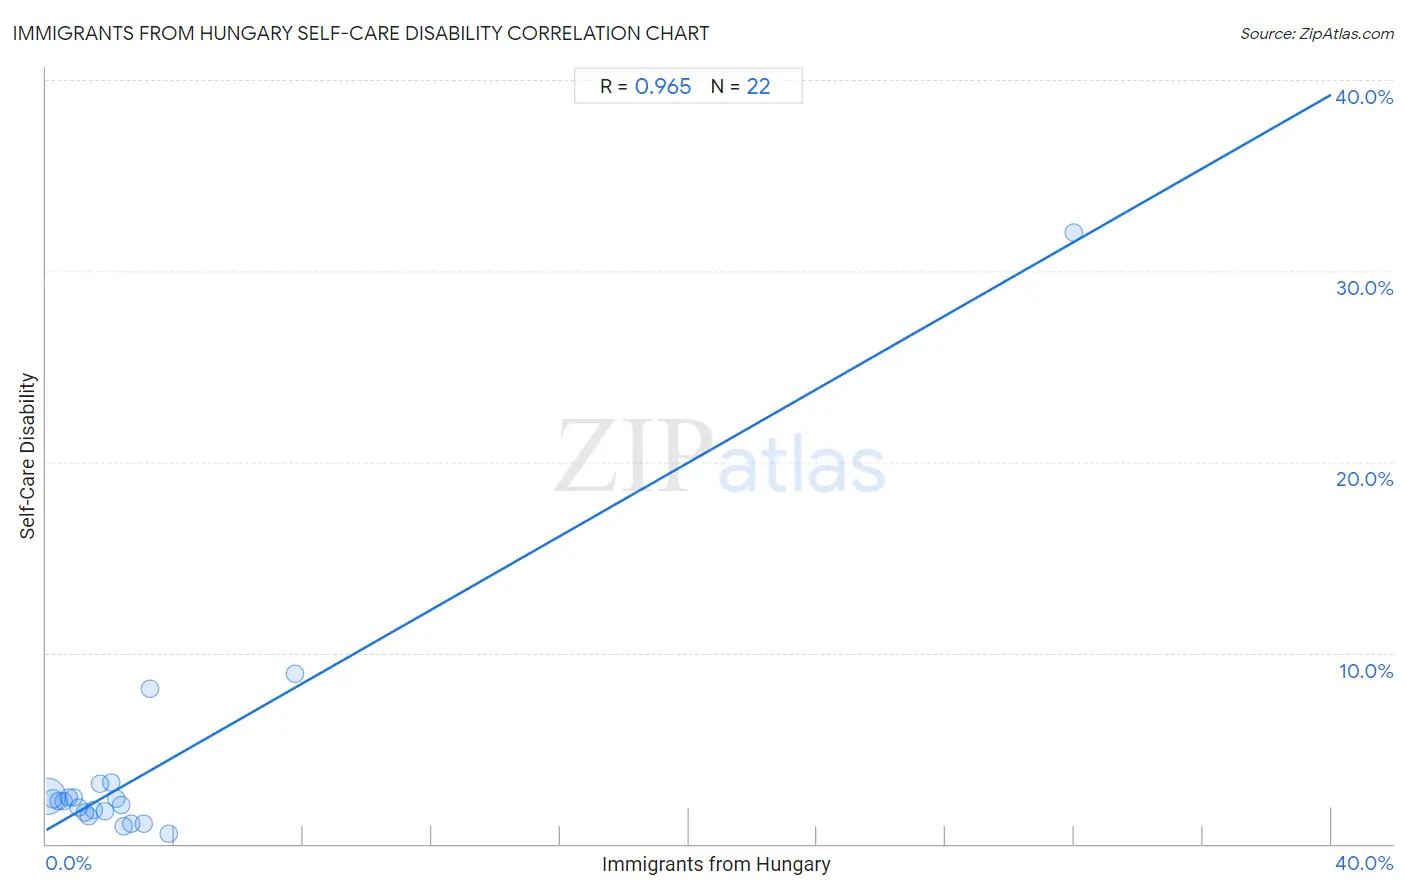
Immigrants from Hungary Self-Care Disability Correlation Chart
The statistical analysis conducted on geographies consisting of 195,644,142 people shows a perfect positive correlation between the proportion of Immigrants from Hungary and percentage of population with self-care disability in the United States with a correlation coefficient (R) of 0.965 and weighted average of 2.4%. On average, for every 1% (one percent) increase in Immigrants from Hungary within a typical geography, there is an increase of 0.96% in percentage of population with self-care disability.
It is essential to understand that the correlation between the percentage of Immigrants from Hungary and percentage of population with self-care disability does not imply a direct cause-and-effect relationship. It remains uncertain whether the presence of Immigrants from Hungary influences an upward or downward trend in the level of percentage of population with self-care disability within an area, or if Immigrants from Hungary simply ended up residing in those areas with higher or lower levels of percentage of population with self-care disability due to other factors.
Demographics Similar to Immigrants from Hungary by Self-Care Disability
In terms of self-care disability, the demographic groups most similar to Immigrants from Hungary are Colombian (2.4%, a difference of 0.010%), Hmong (2.4%, a difference of 0.040%), Immigrants from Romania (2.4%, a difference of 0.050%), Immigrants from Morocco (2.4%, a difference of 0.080%), and Immigrants from North America (2.4%, a difference of 0.080%).
| Demographics | Rating | Rank | Self-Care Disability |
| Peruvians | 91.3 /100 | #121 | Exceptional 2.4% |
| Belgians | 90.9 /100 | #122 | Exceptional 2.4% |
| Immigrants from Nigeria | 90.3 /100 | #123 | Exceptional 2.4% |
| Immigrants from Morocco | 90.2 /100 | #124 | Exceptional 2.4% |
| Immigrants from North America | 90.2 /100 | #124 | Exceptional 2.4% |
| Hmong | 89.9 /100 | #126 | Excellent 2.4% |
| Colombians | 89.7 /100 | #127 | Excellent 2.4% |
| Immigrants from Hungary | 89.6 /100 | #128 | Excellent 2.4% |
| Immigrants from Romania | 89.3 /100 | #129 | Excellent 2.4% |
| Immigrants from Austria | 89.0 /100 | #130 | Excellent 2.4% |
| Poles | 88.9 /100 | #131 | Excellent 2.4% |
| Immigrants from South America | 88.8 /100 | #132 | Excellent 2.4% |
| Immigrants from Colombia | 88.5 /100 | #133 | Excellent 2.4% |
| Russians | 88.2 /100 | #134 | Excellent 2.4% |
| Laotians | 87.8 /100 | #135 | Excellent 2.4% |
Immigrants from Hungary Self-Care Disability Correlation Summary
| Measurement | Immigrants from Hungary Data | Self-Care Disability Data |
| Minimum | 0.039% | 0.51% |
| Maximum | 32.0% | 32.0% |
| Range | 32.0% | 31.5% |
| Mean | 3.3% | 3.9% |
| Median | 1.8% | 2.2% |
| Interquartile 25% (IQ1) | 0.87% | 1.7% |
| Interquartile 75% (IQ3) | 2.6% | 2.5% |
| Interquartile Range (IQR) | 1.8% | 0.80% |
| Standard Deviation (Sample) | 6.6% | 6.6% |
| Standard Deviation (Population) | 6.5% | 6.4% |
Correlation Details
| Immigrants from Hungary Percentile | Sample Size | Self-Care Disability |
[ 0.0% - 0.5% ] 0.039% | 180,539,245 | 2.5% |
[ 0.0% - 0.5% ] 0.22% | 11,023,708 | 2.4% |
[ 0.0% - 0.5% ] 0.39% | 2,387,148 | 2.2% |
[ 0.5% - 1.0% ] 0.55% | 999,034 | 2.3% |
[ 0.5% - 1.0% ] 0.70% | 300,112 | 2.4% |
[ 0.5% - 1.0% ] 0.87% | 124,901 | 2.4% |
[ 1.0% - 1.5% ] 1.01% | 47,344 | 1.9% |
[ 1.0% - 1.5% ] 1.19% | 84,811 | 1.7% |
[ 1.0% - 1.5% ] 1.31% | 6,499 | 1.4% |
[ 1.0% - 1.5% ] 1.48% | 49,565 | 1.8% |
[ 1.5% - 2.0% ] 1.69% | 15,069 | 3.1% |
[ 1.5% - 2.0% ] 1.82% | 1,321 | 1.7% |
[ 2.0% - 2.5% ] 2.02% | 34,658 | 3.2% |
[ 2.0% - 2.5% ] 2.19% | 9,054 | 2.4% |
[ 2.0% - 2.5% ] 2.33% | 1,546 | 2.0% |
[ 2.0% - 2.5% ] 2.42% | 4,420 | 0.90% |
[ 2.5% - 3.0% ] 2.65% | 3,968 | 1.0% |
[ 3.0% - 3.5% ] 3.03% | 8,612 | 1.1% |
[ 3.0% - 3.5% ] 3.23% | 124 | 8.1% |
[ 3.5% - 4.0% ] 3.81% | 1,599 | 0.51% |
[ 7.5% - 8.0% ] 7.76% | 1,379 | 8.9% |
[ 32.0% - 32.5% ] 32.00% | 25 | 32.0% |