Scotch-Irish Median Male Earnings
COMPARE
Scotch-Irish
Select to Compare
Median Male Earnings
Scotch-Irish Median Male Earnings
$53,658
EARNINGS | MALES
30.6/ 100
METRIC RATING
192nd/ 347
METRIC RANK
Scotch-Irish Median Male Earnings Correlation Chart
The statistical analysis conducted on geographies consisting of 547,724,250 people shows a weak negative correlation between the proportion of Scotch-Irish and median male earnings in the United States with a correlation coefficient (R) of -0.290 and weighted average of $53,658. On average, for every 1% (one percent) increase in Scotch-Irish within a typical geography, there is a decrease of $394 in median male earnings.
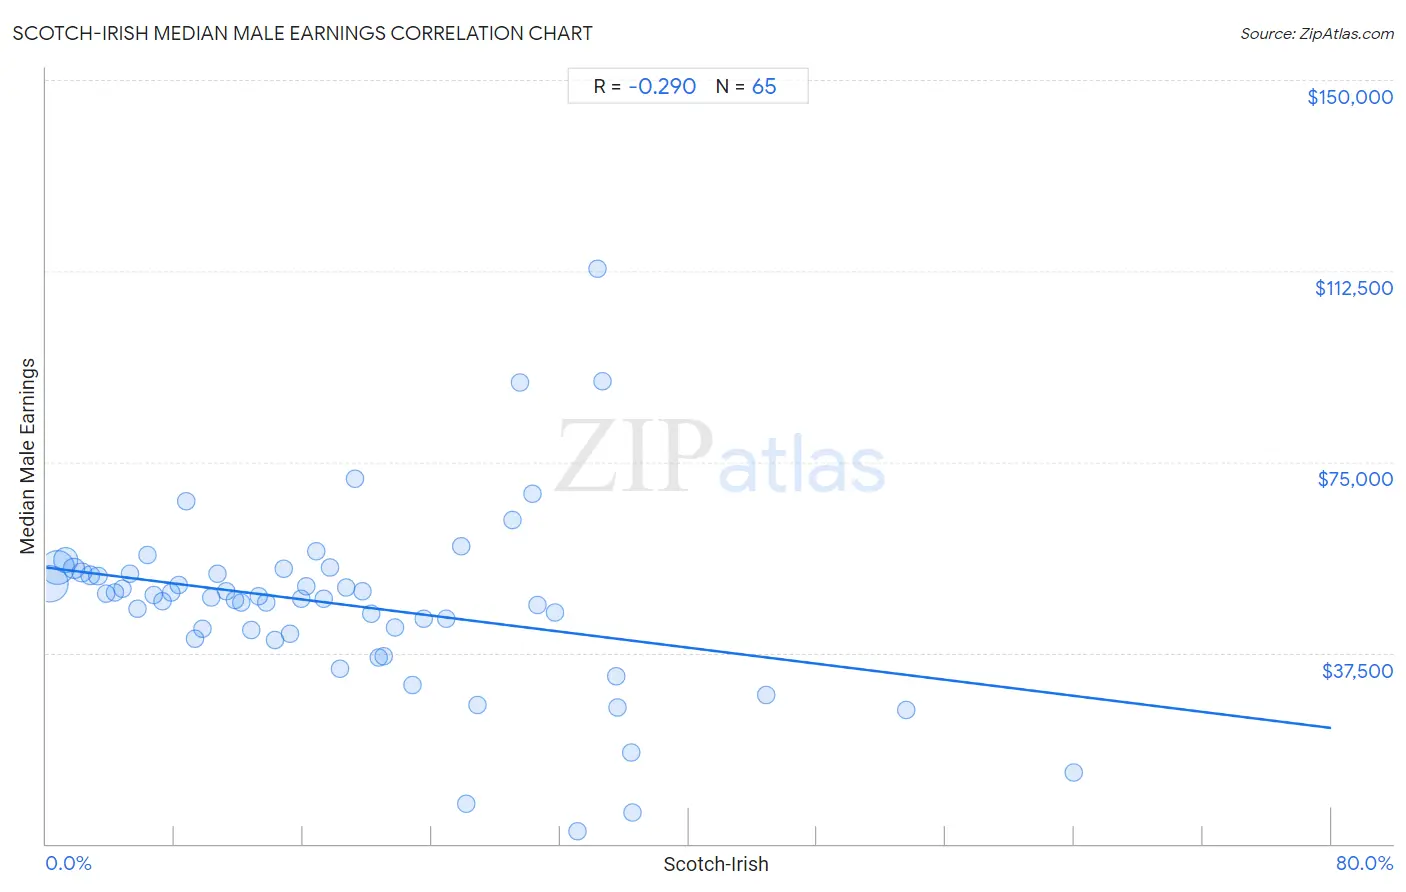
It is essential to understand that the correlation between the percentage of Scotch-Irish and median male earnings does not imply a direct cause-and-effect relationship. It remains uncertain whether the presence of Scotch-Irish influences an upward or downward trend in the level of median male earnings within an area, or if Scotch-Irish simply ended up residing in those areas with higher or lower levels of median male earnings due to other factors.
Demographics Similar to Scotch-Irish by Median Male Earnings
In terms of median male earnings, the demographic groups most similar to Scotch-Irish are Guamanian/Chamorro ($53,661, a difference of 0.010%), Kenyan ($53,647, a difference of 0.020%), Uruguayan ($53,680, a difference of 0.040%), Puget Sound Salish ($53,704, a difference of 0.090%), and Immigrants from Eastern Africa ($53,713, a difference of 0.10%).
| Demographics | Rating | Rank | Median Male Earnings |
| Immigrants from Sierra Leone | 36.0 /100 | #185 | Fair $53,905 |
| Colombians | 34.4 /100 | #186 | Fair $53,832 |
| Immigrants from Eritrea | 31.8 /100 | #187 | Fair $53,715 |
| Immigrants from Eastern Africa | 31.8 /100 | #188 | Fair $53,713 |
| Puget Sound Salish | 31.6 /100 | #189 | Fair $53,704 |
| Uruguayans | 31.1 /100 | #190 | Fair $53,680 |
| Guamanians/Chamorros | 30.7 /100 | #191 | Fair $53,661 |
| Scotch-Irish | 30.6 /100 | #192 | Fair $53,658 |
| Kenyans | 30.4 /100 | #193 | Fair $53,647 |
| Spanish | 29.0 /100 | #194 | Fair $53,576 |
| Immigrants from the Azores | 27.5 /100 | #195 | Fair $53,503 |
| Immigrants from Africa | 26.6 /100 | #196 | Fair $53,457 |
| Immigrants from Kenya | 26.0 /100 | #197 | Fair $53,427 |
| Immigrants from Costa Rica | 22.6 /100 | #198 | Fair $53,237 |
| Tongans | 22.3 /100 | #199 | Fair $53,218 |
Scotch-Irish Median Male Earnings Correlation Summary
| Measurement | Scotch-Irish Data | Median Male Earnings Data |
| Minimum | 0.25% | $2,499 |
| Maximum | 64.0% | $113,000 |
| Range | 63.7% | $110,501 |
| Mean | 18.3% | $47,040 |
| Median | 16.2% | $48,432 |
| Interquartile 25% (IQ1) | 8.0% | $40,813 |
| Interquartile 75% (IQ3) | 26.5% | $53,223 |
| Interquartile Range (IQR) | 18.5% | $12,411 |
| Standard Deviation (Sample) | 13.2% | $17,914 |
| Standard Deviation (Population) | 13.1% | $17,776 |
Correlation Details
| Scotch-Irish Percentile | Sample Size | Median Male Earnings |
[ 0.0% - 0.5% ] 0.25% | 210,640,858 | $51,109 |
[ 0.5% - 1.0% ] 0.72% | 183,078,160 | $54,299 |
[ 1.0% - 1.5% ] 1.21% | 82,585,905 | $55,639 |
[ 1.5% - 2.0% ] 1.72% | 36,361,213 | $54,096 |
[ 2.0% - 2.5% ] 2.21% | 15,841,543 | $53,311 |
[ 2.5% - 3.0% ] 2.73% | 7,800,979 | $52,711 |
[ 3.0% - 3.5% ] 3.23% | 5,098,825 | $52,566 |
[ 3.5% - 4.0% ] 3.75% | 2,421,695 | $49,049 |
[ 4.0% - 4.5% ] 4.25% | 1,259,694 | $49,361 |
[ 4.5% - 5.0% ] 4.76% | 727,991 | $50,005 |
[ 5.0% - 5.5% ] 5.23% | 636,351 | $53,136 |
[ 5.5% - 6.0% ] 5.71% | 310,418 | $46,211 |
[ 6.0% - 6.5% ] 6.29% | 191,073 | $56,731 |
[ 6.5% - 7.0% ] 6.71% | 135,199 | $48,956 |
[ 7.0% - 7.5% ] 7.24% | 108,963 | $47,620 |
[ 7.5% - 8.0% ] 7.79% | 104,145 | $49,331 |
[ 8.0% - 8.5% ] 8.22% | 70,854 | $50,900 |
[ 8.5% - 9.0% ] 8.75% | 57,382 | $67,206 |
[ 9.0% - 9.5% ] 9.25% | 38,801 | $40,384 |
[ 9.5% - 10.0% ] 9.76% | 38,228 | $42,274 |
[ 10.0% - 10.5% ] 10.27% | 36,114 | $48,432 |
[ 10.5% - 11.0% ] 10.69% | 21,979 | $52,952 |
[ 11.0% - 11.5% ] 11.24% | 17,343 | $49,636 |
[ 11.5% - 12.0% ] 11.78% | 16,007 | $47,876 |
[ 12.0% - 12.5% ] 12.18% | 6,717 | $47,261 |
[ 12.5% - 13.0% ] 12.77% | 4,511 | $42,045 |
[ 13.0% - 13.5% ] 13.22% | 18,587 | $48,669 |
[ 13.5% - 14.0% ] 13.71% | 16,568 | $47,328 |
[ 14.0% - 14.5% ] 14.25% | 14,460 | $40,052 |
[ 14.5% - 15.0% ] 14.80% | 2,250 | $54,006 |
[ 15.0% - 15.5% ] 15.14% | 5,745 | $41,241 |
[ 15.5% - 16.0% ] 15.87% | 3,769 | $48,127 |
[ 16.0% - 16.5% ] 16.21% | 9,802 | $50,617 |
[ 16.5% - 17.0% ] 16.81% | 4,711 | $57,345 |
[ 17.0% - 17.5% ] 17.27% | 6,300 | $48,169 |
[ 17.5% - 18.0% ] 17.66% | 8,772 | $54,345 |
[ 18.0% - 18.5% ] 18.32% | 2,123 | $34,369 |
[ 18.5% - 19.0% ] 18.67% | 1,221 | $50,264 |
[ 19.0% - 19.5% ] 19.21% | 1,452 | $71,761 |
[ 19.5% - 20.0% ] 19.72% | 1,136 | $49,600 |
[ 20.0% - 20.5% ] 20.24% | 672 | $45,059 |
[ 20.5% - 21.0% ] 20.71% | 2,260 | $36,606 |
[ 21.0% - 21.5% ] 21.04% | 423 | $36,722 |
[ 21.5% - 22.0% ] 21.71% | 1,741 | $42,461 |
[ 22.5% - 23.0% ] 22.77% | 1,458 | $31,197 |
[ 23.0% - 23.5% ] 23.48% | 903 | $44,297 |
[ 24.5% - 25.0% ] 24.87% | 1,777 | $44,287 |
[ 25.5% - 26.0% ] 25.87% | 317 | $58,375 |
[ 26.0% - 26.5% ] 26.17% | 405 | $7,770 |
[ 26.5% - 27.0% ] 26.87% | 67 | $27,344 |
[ 28.5% - 29.0% ] 29.00% | 100 | $63,594 |
[ 29.0% - 29.5% ] 29.49% | 217 | $90,527 |
[ 30.0% - 30.5% ] 30.24% | 2,609 | $68,702 |
[ 30.5% - 31.0% ] 30.57% | 386 | $46,875 |
[ 31.5% - 32.0% ] 31.65% | 79 | $45,450 |
[ 33.0% - 33.5% ] 33.06% | 121 | $2,499 |
[ 34.0% - 34.5% ] 34.33% | 233 | $113,000 |
[ 34.5% - 35.0% ] 34.59% | 185 | $90,742 |
[ 35.0% - 35.5% ] 35.46% | 141 | $32,969 |
[ 35.5% - 36.0% ] 35.54% | 166 | $26,688 |
[ 36.0% - 36.5% ] 36.40% | 728 | $17,829 |
[ 36.5% - 37.0% ] 36.53% | 605 | $6,076 |
[ 44.5% - 45.0% ] 44.84% | 339 | $29,245 |
[ 53.5% - 54.0% ] 53.51% | 299 | $26,284 |
[ 64.0% - 64.5% ] 64.00% | 175 | $13,981 |