Scotch-Irish Hearing Disability
COMPARE
Scotch-Irish
Select to Compare
Hearing Disability
Scotch-Irish Hearing Disability
3.8%
HEARING DISABILITY
0.0/ 100
METRIC RATING
309th/ 347
METRIC RANK
Scotch-Irish Hearing Disability Correlation Chart
The statistical analysis conducted on geographies consisting of 548,308,255 people shows a mild positive correlation between the proportion of Scotch-Irish and percentage of population with hearing disability in the United States with a correlation coefficient (R) of 0.385 and weighted average of 3.8%. On average, for every 1% (one percent) increase in Scotch-Irish within a typical geography, there is an increase of 0.23% in percentage of population with hearing disability.
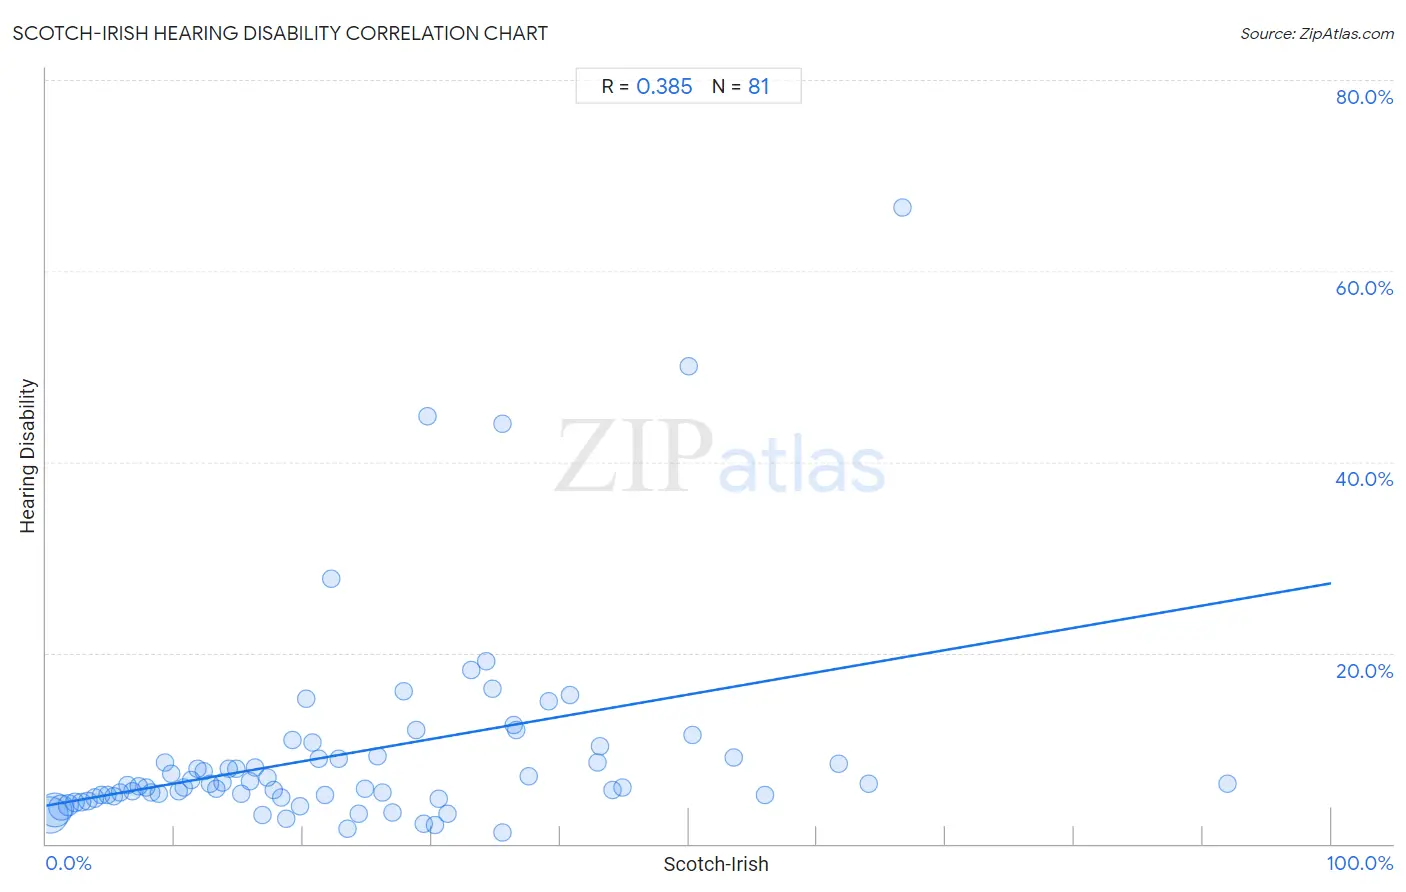
It is essential to understand that the correlation between the percentage of Scotch-Irish and percentage of population with hearing disability does not imply a direct cause-and-effect relationship. It remains uncertain whether the presence of Scotch-Irish influences an upward or downward trend in the level of percentage of population with hearing disability within an area, or if Scotch-Irish simply ended up residing in those areas with higher or lower levels of percentage of population with hearing disability due to other factors.
Demographics Similar to Scotch-Irish by Hearing Disability
In terms of hearing disability, the demographic groups most similar to Scotch-Irish are Ottawa (3.8%, a difference of 0.080%), Cree (3.8%, a difference of 0.31%), French Canadian (3.8%, a difference of 0.52%), Marshallese (3.8%, a difference of 0.64%), and English (3.8%, a difference of 1.5%).
| Demographics | Rating | Rank | Hearing Disability |
| Dutch | 0.0 /100 | #302 | Tragic 3.7% |
| Menominee | 0.0 /100 | #303 | Tragic 3.7% |
| French | 0.0 /100 | #304 | Tragic 3.8% |
| English | 0.0 /100 | #305 | Tragic 3.8% |
| Marshallese | 0.0 /100 | #306 | Tragic 3.8% |
| French Canadians | 0.0 /100 | #307 | Tragic 3.8% |
| Ottawa | 0.0 /100 | #308 | Tragic 3.8% |
| Scotch-Irish | 0.0 /100 | #309 | Tragic 3.8% |
| Cree | 0.0 /100 | #310 | Tragic 3.8% |
| Americans | 0.0 /100 | #311 | Tragic 3.9% |
| Cajuns | 0.0 /100 | #312 | Tragic 3.9% |
| Hopi | 0.0 /100 | #313 | Tragic 3.9% |
| Yakama | 0.0 /100 | #314 | Tragic 3.9% |
| Puget Sound Salish | 0.0 /100 | #315 | Tragic 3.9% |
| Spanish Americans | 0.0 /100 | #316 | Tragic 4.0% |
Scotch-Irish Hearing Disability Correlation Summary
| Measurement | Scotch-Irish Data | Hearing Disability Data |
| Minimum | 0.25% | 1.2% |
| Maximum | 91.9% | 66.7% |
| Range | 91.6% | 65.5% |
| Mean | 23.7% | 9.5% |
| Median | 20.2% | 6.1% |
| Interquartile 25% (IQ1) | 10.0% | 4.9% |
| Interquartile 75% (IQ3) | 34.5% | 9.1% |
| Interquartile Range (IQR) | 24.5% | 4.2% |
| Standard Deviation (Sample) | 17.8% | 10.8% |
| Standard Deviation (Population) | 17.7% | 10.7% |
Correlation Details
| Scotch-Irish Percentile | Sample Size | Hearing Disability |
[ 0.0% - 0.5% ] 0.25% | 210,683,862 | 3.0% |
[ 0.5% - 1.0% ] 0.72% | 183,180,557 | 3.5% |
[ 1.0% - 1.5% ] 1.21% | 82,654,761 | 3.7% |
[ 1.5% - 2.0% ] 1.72% | 36,451,087 | 4.0% |
[ 2.0% - 2.5% ] 2.21% | 15,901,421 | 4.3% |
[ 2.5% - 3.0% ] 2.73% | 7,861,002 | 4.3% |
[ 3.0% - 3.5% ] 3.23% | 5,114,986 | 4.5% |
[ 3.5% - 4.0% ] 3.75% | 2,452,812 | 4.8% |
[ 4.0% - 4.5% ] 4.25% | 1,267,908 | 5.1% |
[ 4.5% - 5.0% ] 4.76% | 743,448 | 5.1% |
[ 5.0% - 5.5% ] 5.23% | 640,348 | 4.9% |
[ 5.5% - 6.0% ] 5.71% | 325,008 | 5.4% |
[ 6.0% - 6.5% ] 6.29% | 207,443 | 6.1% |
[ 6.5% - 7.0% ] 6.71% | 138,773 | 5.5% |
[ 7.0% - 7.5% ] 7.23% | 118,933 | 6.0% |
[ 7.5% - 8.0% ] 7.79% | 112,270 | 5.9% |
[ 8.0% - 8.5% ] 8.22% | 76,136 | 5.4% |
[ 8.5% - 9.0% ] 8.75% | 59,406 | 5.2% |
[ 9.0% - 9.5% ] 9.24% | 37,268 | 8.5% |
[ 9.5% - 10.0% ] 9.76% | 38,664 | 7.3% |
[ 10.0% - 10.5% ] 10.27% | 37,490 | 5.5% |
[ 10.5% - 11.0% ] 10.70% | 25,588 | 5.9% |
[ 11.0% - 11.5% ] 11.24% | 20,175 | 6.7% |
[ 11.5% - 12.0% ] 11.80% | 17,472 | 7.9% |
[ 12.0% - 12.5% ] 12.24% | 9,309 | 7.6% |
[ 12.5% - 13.0% ] 12.76% | 4,850 | 6.3% |
[ 13.0% - 13.5% ] 13.22% | 18,982 | 5.8% |
[ 13.5% - 14.0% ] 13.70% | 16,922 | 6.5% |
[ 14.0% - 14.5% ] 14.25% | 15,105 | 7.8% |
[ 14.5% - 15.0% ] 14.82% | 3,152 | 7.8% |
[ 15.0% - 15.5% ] 15.17% | 6,541 | 5.3% |
[ 15.5% - 16.0% ] 15.86% | 4,923 | 6.5% |
[ 16.0% - 16.5% ] 16.21% | 10,804 | 8.0% |
[ 16.5% - 17.0% ] 16.81% | 5,104 | 3.0% |
[ 17.0% - 17.5% ] 17.24% | 7,273 | 6.9% |
[ 17.5% - 18.0% ] 17.66% | 9,219 | 5.6% |
[ 18.0% - 18.5% ] 18.31% | 1,764 | 4.9% |
[ 18.5% - 19.0% ] 18.65% | 2,970 | 2.6% |
[ 19.0% - 19.5% ] 19.18% | 1,517 | 10.8% |
[ 19.5% - 20.0% ] 19.72% | 1,009 | 4.0% |
[ 20.0% - 20.5% ] 20.25% | 726 | 15.2% |
[ 20.5% - 21.0% ] 20.74% | 2,748 | 10.7% |
[ 21.0% - 21.5% ] 21.24% | 1,356 | 8.8% |
[ 21.5% - 22.0% ] 21.71% | 1,773 | 5.0% |
[ 22.0% - 22.5% ] 22.22% | 18 | 27.8% |
[ 22.5% - 23.0% ] 22.77% | 1,458 | 8.9% |
[ 23.0% - 23.5% ] 23.48% | 903 | 1.6% |
[ 24.0% - 24.5% ] 24.34% | 226 | 3.1% |
[ 24.5% - 25.0% ] 24.85% | 1,710 | 5.8% |
[ 25.5% - 26.0% ] 25.79% | 570 | 9.1% |
[ 26.0% - 26.5% ] 26.19% | 168 | 5.4% |
[ 26.5% - 27.0% ] 26.92% | 364 | 3.3% |
[ 27.5% - 28.0% ] 27.85% | 237 | 16.0% |
[ 28.5% - 29.0% ] 28.81% | 354 | 11.9% |
[ 29.0% - 29.5% ] 29.42% | 469 | 2.1% |
[ 29.5% - 30.0% ] 29.66% | 145 | 44.8% |
[ 30.0% - 30.5% ] 30.26% | 3,024 | 2.0% |
[ 30.5% - 31.0% ] 30.57% | 386 | 4.7% |
[ 31.0% - 31.5% ] 31.25% | 32 | 3.1% |
[ 33.0% - 33.5% ] 33.06% | 121 | 18.2% |
[ 34.0% - 34.5% ] 34.26% | 683 | 19.2% |
[ 34.5% - 35.0% ] 34.73% | 357 | 16.2% |
[ 35.0% - 35.5% ] 35.46% | 141 | 44.0% |
[ 35.5% - 36.0% ] 35.54% | 166 | 1.2% |
[ 36.0% - 36.5% ] 36.40% | 728 | 12.5% |
[ 36.5% - 37.0% ] 36.53% | 605 | 11.9% |
[ 37.5% - 38.0% ] 37.58% | 157 | 7.0% |
[ 39.0% - 39.5% ] 39.08% | 87 | 14.9% |
[ 40.5% - 41.0% ] 40.78% | 103 | 15.5% |
[ 42.5% - 43.0% ] 42.86% | 35 | 8.6% |
[ 43.0% - 43.5% ] 43.13% | 473 | 10.1% |
[ 44.0% - 44.5% ] 44.08% | 338 | 5.6% |
[ 44.5% - 45.0% ] 44.84% | 339 | 5.9% |
[ 50.0% - 50.5% ] 50.00% | 26 | 50.0% |
[ 50.0% - 50.5% ] 50.34% | 149 | 11.4% |
[ 53.5% - 54.0% ] 53.51% | 299 | 9.0% |
[ 55.5% - 56.0% ] 55.93% | 59 | 5.1% |
[ 61.5% - 62.0% ] 61.67% | 60 | 8.3% |
[ 64.0% - 64.5% ] 64.00% | 175 | 6.3% |
[ 66.5% - 67.0% ] 66.67% | 3 | 66.7% |
[ 91.5% - 92.0% ] 91.89% | 222 | 6.3% |