South African Self-Care Disability

COMPARE

South African
Race
Ancestry
AfghanAfricanAlaska NativeAlaskan AthabascanAlbanianAleutAlsatianAmericanApacheArabArapahoArgentineanArmenianAssyrian/Chaldean/SyriacAustralianAustrianBahamianBangladeshiBarbadianBasqueBelgianBelizeanBermudanBhutaneseBlackfeetBolivianBrazilianBritishBritish West IndianBulgarianBurmeseCajunCambodianCanadianCape VerdeanCarpatho RusynCelticCentral AmericanCentral American IndianCherokeeCheyenneChickasawChileanChineseChippewaChoctawColombianColvilleComancheCosta RicanCreeCreekCroatianCrowCubanCypriotCzechCzechoslovakianDanishDelawareDominicanDutchDutch West IndianEastern EuropeanEcuadorianEgyptianEnglishEstonianEthiopianEuropeanFijianFilipinoFinnishFrenchFrench American IndianFrench CanadianGermanGerman RussianGhanaianGreekGuamanian/ChamorroGuatemalanGuyaneseHaitianHmongHonduranHopiHoumaHungarianIcelanderIndian (Asian)IndonesianInupiatIranianIraqiIrishIroquoisIsraeliItalianJamaicanJapaneseJordanianKenyanKiowaKoreanLaotianLatvianLebaneseLiberianLithuanianLumbeeLuxembourgerMacedonianMalaysianMalteseMarshalleseMenomineeMexicanMexican American IndianMongolianMoroccanNative HawaiianNavajoNepaleseNew ZealanderNicaraguanNigerianNorthern EuropeanNorwegianOkinawanOsageOttawaPaiutePakistaniPalestinianPanamanianParaguayanPennsylvania GermanPeruvianPimaPolishPortuguesePotawatomiPuebloPuerto RicanPuget Sound SalishRomanianRussianSalvadoranSamoanScandinavianScotch-IrishScottishSeminoleSenegaleseSerbianShoshoneSierra LeoneanSiouxSlavicSlovakSloveneSomaliSouth AfricanSouth AmericanSouth American IndianSoviet UnionSpaniardSpanishSpanish AmericanSpanish American IndianSri LankanSubsaharan AfricanSudaneseSwedishSwissSyrianTaiwaneseThaiTlingit-HaidaTohono O'OdhamTonganTrinidadian and TobagonianTsimshianTurkishU.S. Virgin IslanderUgandanUkrainianUruguayanUteVenezuelanVietnameseWelshWest IndianYakamaYaquiYugoslavianYumanYup'ikZimbabwean
Immigration
NonimmigrantsImmigrantsAfghanistanAfricaAlbaniaArgentinaArmeniaAsiaAustraliaAustriaBahamasBangladeshBarbadosBelarusBelgiumBelizeBoliviaBosnia and HerzegovinaBrazilBulgariaBurma/MyanmarCabo VerdeCambodiaCameroonCanadaCaribbeanCentral AmericaChileChinaColombiaCongoCosta RicaCroatiaCubaCzechoslovakiaDenmarkDominicaDominican RepublicEastern AfricaEastern AsiaEastern EuropeEcuadorEgyptEl SalvadorEnglandEritreaEthiopiaEuropeFijiFranceGermanyGhanaGreeceGrenadaGuatemalaGuyanaHaitiHondurasHong KongHungaryIndiaIndonesiaIranIraqIrelandIsraelItalyJamaicaJapanJordanKazakhstanKenyaKoreaKuwaitLaosLatin AmericaLatviaLebanonLiberiaLithuaniaMalaysiaMexicoMicronesiaMiddle AfricaMoldovaMoroccoNepalNetherlandsNicaraguaNigeriaNorth AmericaNorth MacedoniaNorthern AfricaNorthern EuropeNorwayOceaniaPakistanPanamaPeruPhilippinesPolandPortugalRomaniaRussiaSaudi ArabiaScotlandSenegalSerbiaSierra LeoneSingaporeSomaliaSouth AfricaSouth AmericaSouth Central AsiaSouth Eastern AsiaSouthern EuropeSpainSri LankaSt. Vincent and the GrenadinesSudanSwedenSwitzerlandSyriaTaiwanThailandTrinidad and TobagoTurkeyUgandaUkraineUruguayUzbekistanVenezuelaVietnamWest IndiesWestern AfricaWestern AsiaWestern EuropeYemenZaireZimbabweAzores
Select to Compare
Race
Ancestry
AfghanAfricanAlaska NativeAlaskan AthabascanAlbanianAleutAlsatianAmericanApacheArabArapahoArgentineanArmenianAssyrian/Chaldean/SyriacAustralianAustrianBahamianBangladeshiBarbadianBasqueBelgianBelizeanBermudanBhutaneseBlackfeetBolivianBrazilianBritishBritish West IndianBulgarianBurmeseCajunCambodianCanadianCape VerdeanCarpatho RusynCelticCentral AmericanCentral American IndianCherokeeCheyenneChickasawChileanChineseChippewaChoctawColombianColvilleComancheCosta RicanCreeCreekCroatianCrowCubanCypriotCzechCzechoslovakianDanishDelawareDominicanDutchDutch West IndianEastern EuropeanEcuadorianEgyptianEnglishEstonianEthiopianEuropeanFijianFilipinoFinnishFrenchFrench American IndianFrench CanadianGermanGerman RussianGhanaianGreekGuamanian/ChamorroGuatemalanGuyaneseHaitianHmongHonduranHopiHoumaHungarianIcelanderIndian (Asian)IndonesianInupiatIranianIraqiIrishIroquoisIsraeliItalianJamaicanJapaneseJordanianKenyanKiowaKoreanLaotianLatvianLebaneseLiberianLithuanianLumbeeLuxembourgerMacedonianMalaysianMalteseMarshalleseMenomineeMexicanMexican American IndianMongolianMoroccanNative HawaiianNavajoNepaleseNew ZealanderNicaraguanNigerianNorthern EuropeanNorwegianOkinawanOsageOttawaPaiutePakistaniPalestinianPanamanianParaguayanPennsylvania GermanPeruvianPimaPolishPortuguesePotawatomiPuebloPuerto RicanPuget Sound SalishRomanianRussianSalvadoranSamoanScandinavianScotch-IrishScottishSeminoleSenegaleseSerbianShoshoneSierra LeoneanSiouxSlavicSlovakSloveneSomaliSouth AmericanSouth American IndianSoviet UnionSpaniardSpanishSpanish AmericanSpanish American IndianSri LankanSubsaharan AfricanSudaneseSwedishSwissSyrianTaiwaneseThaiTlingit-HaidaTohono O'OdhamTonganTrinidadian and TobagonianTsimshianTurkishU.S. Virgin IslanderUgandanUkrainianUruguayanUteVenezuelanVietnameseWelshWest IndianYakamaYaquiYugoslavianYumanYup'ikZimbabwean
Immigration
NonimmigrantsImmigrantsAfghanistanAfricaAlbaniaArgentinaArmeniaAsiaAustraliaAustriaBahamasBangladeshBarbadosBelarusBelgiumBelizeBoliviaBosnia and HerzegovinaBrazilBulgariaBurma/MyanmarCabo VerdeCambodiaCameroonCanadaCaribbeanCentral AmericaChileChinaColombiaCongoCosta RicaCroatiaCubaCzechoslovakiaDenmarkDominicaDominican RepublicEastern AfricaEastern AsiaEastern EuropeEcuadorEgyptEl SalvadorEnglandEritreaEthiopiaEuropeFijiFranceGermanyGhanaGreeceGrenadaGuatemalaGuyanaHaitiHondurasHong KongHungaryIndiaIndonesiaIranIraqIrelandIsraelItalyJamaicaJapanJordanKazakhstanKenyaKoreaKuwaitLaosLatin AmericaLatviaLebanonLiberiaLithuaniaMalaysiaMexicoMicronesiaMiddle AfricaMoldovaMoroccoNepalNetherlandsNicaraguaNigeriaNorth AmericaNorth MacedoniaNorthern AfricaNorthern EuropeNorwayOceaniaPakistanPanamaPeruPhilippinesPolandPortugalRomaniaRussiaSaudi ArabiaScotlandSenegalSerbiaSierra LeoneSingaporeSomaliaSouth AfricaSouth AmericaSouth Central AsiaSouth Eastern AsiaSouthern EuropeSpainSri LankaSt. Vincent and the GrenadinesSudanSwedenSwitzerlandSyriaTaiwanThailandTrinidad and TobagoTurkeyUgandaUkraineUruguayUzbekistanVenezuelaVietnamWest IndiesWestern AfricaWestern AsiaWestern EuropeYemenZaireZimbabweAzores
Self-Care Disability
Income
Poverty
Unemployment
Labor Participation
Family Structure
Vehicle Availability
Education Level
Disability

South African Self-Care Disability
Exceptional

2.3%
SELF-CARE DISABILITY
99.3/ 100
METRIC RATING
67th/ 347
METRIC RANK

South African Self-Care Disability Correlation Chart

The statistical analysis conducted on geographies consisting of 182,494,090 people shows a weak negative correlation between the proportion of South Africans and percentage of population with self-care disability in the United States with a correlation coefficient (R) of -0.253 and weighted average of 2.3%. On average, for every 1% (one percent) increase in South Africans within a typical geography, there is a decrease of 0.11% in percentage of population with self-care disability.
South African Self-Care Disability
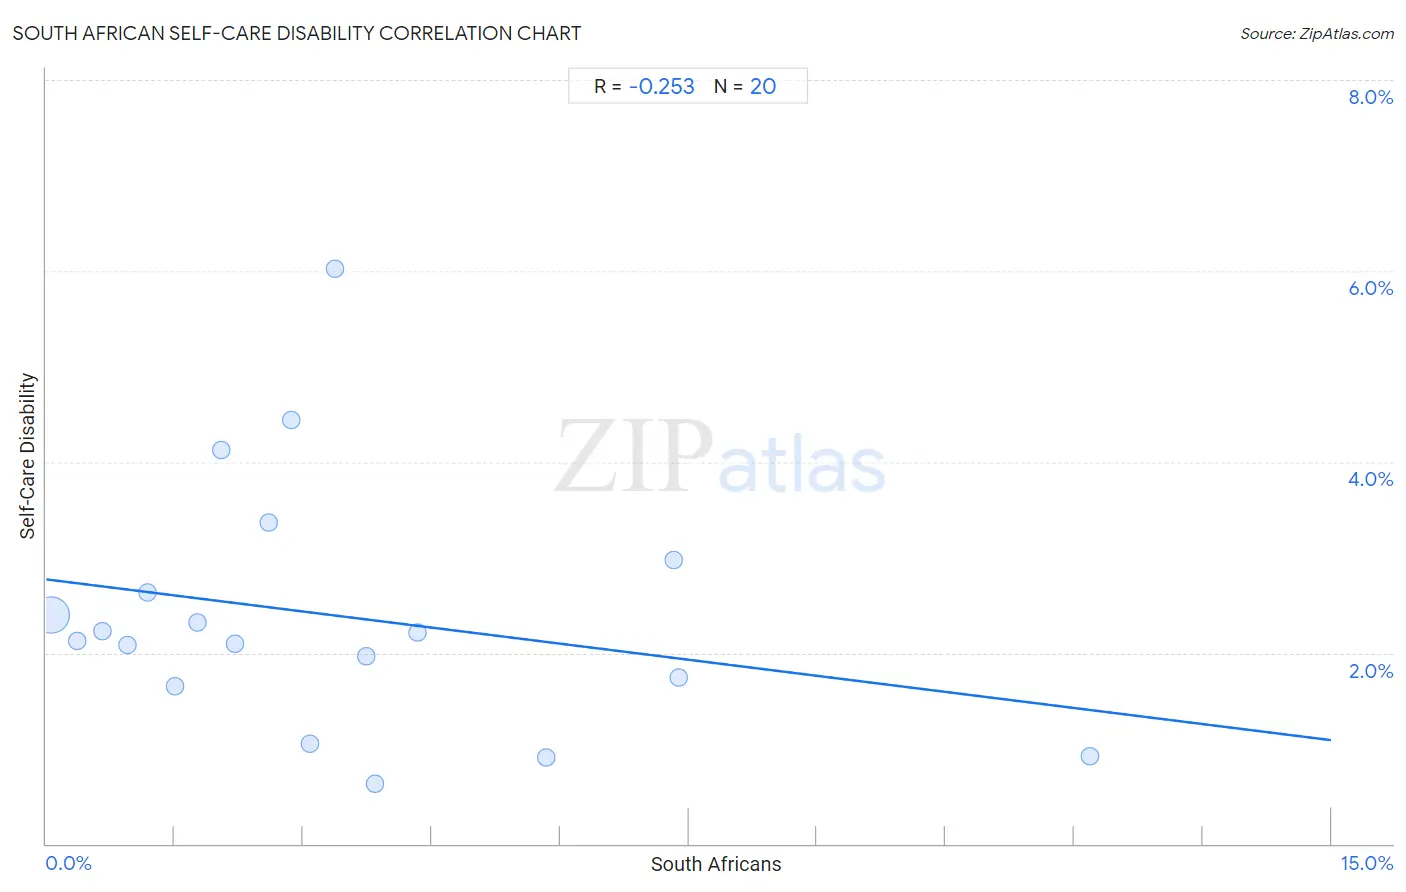
It is essential to understand that the correlation between the percentage of South Africans and percentage of population with self-care disability does not imply a direct cause-and-effect relationship. It remains uncertain whether the presence of South Africans influences an upward or downward trend in the level of percentage of population with self-care disability within an area, or if South Africans simply ended up residing in those areas with higher or lower levels of percentage of population with self-care disability due to other factors.

Demographics Similar to South Africans by Self-Care Disability

In terms of self-care disability, the demographic groups most similar to South Africans are Immigrants from Argentina (2.3%, a difference of 0.030%), Brazilian (2.3%, a difference of 0.060%), Immigrants from Zaire (2.3%, a difference of 0.090%), Immigrants from Norway (2.3%, a difference of 0.090%), and Swedish (2.3%, a difference of 0.12%).
DemographicsRating | RankSelf-Care Disability
Immigrants from Japan
99.5
/100
|
#60
Exceptional
2.3%
Palestinians
99.4
/100
|
#61
Exceptional
2.3%
Egyptians
99.4
/100
|
#62
Exceptional
2.3%
Mongolians
99.3
/100
|
#63
Exceptional
2.3%
Swedes
99.3
/100
|
#64
Exceptional
2.3%
Brazilians
99.3
/100
|
#65
Exceptional
2.3%
Immigrants from Argentina
99.3
/100
|
#66
Exceptional
2.3%
South Africans
99.3
/100
|
#67
Exceptional
2.3%
Immigrants from Zaire
99.2
/100
|
#68
Exceptional
2.3%
Immigrants from Norway
99.2
/100
|
#69
Exceptional
2.3%
Immigrants from Northern Europe
99.2
/100
|
#70
Exceptional
2.3%
Asians
99.2
/100
|
#71
Exceptional
2.3%
Eastern Europeans
99.2
/100
|
#72
Exceptional
2.3%
Immigrants from Egypt
99.1
/100
|
#73
Exceptional
2.3%
Immigrants from Switzerland
99.1
/100
|
#74
Exceptional
2.3%

South African Self-Care Disability Correlation Summary

MeasurementSouth African DataSelf-Care Disability Data
Minimum0.053%0.63%
Maximum12.2%6.0%
Range12.1%5.4%
Mean3.4%2.4%
Median2.7%2.2%
Interquartile 25% (IQ1)1.3%1.7%
Interquartile 75% (IQ3)4.1%2.8%
Interquartile Range (IQR)2.7%1.1%
Standard Deviation (Sample)2.9%1.3%
Standard Deviation (Population)2.9%1.3%

Correlation Details

South African PercentileSample SizeSelf-Care Disability
[
0.0%
-
0.5%
]
0.053%
173,852,0742.4%
[
0.0%
-
0.5%
]
0.36%
5,942,9032.1%
[
0.5%
-
1.0%
]
0.66%
1,544,5242.2%
[
0.5%
-
1.0%
]
0.95%
541,5752.1%
[
1.0%
-
1.5%
]
1.18%
173,4152.6%
[
1.0%
-
1.5%
]
1.50%
149,4951.6%
[
1.5%
-
2.0%
]
1.77%
68,7852.3%
[
2.0%
-
2.5%
]
2.04%
57,6764.1%
[
2.0%
-
2.5%
]
2.20%
21,6932.1%
[
2.5%
-
3.0%
]
2.59%
32,6683.4%
[
2.5%
-
3.0%
]
2.86%
21,2904.4%
[
3.0%
-
3.5%
]
3.08%
38,1141.0%
[
3.0%
-
3.5%
]
3.37%
4,7176.0%
[
3.5%
-
4.0%
]
3.73%
9,5882.0%
[
3.5%
-
4.0%
]
3.84%
26,4980.63%
[
4.0%
-
4.5%
]
4.34%
4,4502.2%
[
5.5%
-
6.0%
]
5.84%
3770.90%
[
7.0%
-
7.5%
]
7.33%
1,6383.0%
[
7.0%
-
7.5%
]
7.38%
1,6251.7%
[
12.0%
-
12.5%
]
12.18%
9850.91%