Cajun Self-Care Disability
COMPARE
Cajun
Select to Compare
Self-Care Disability
Cajun Self-Care Disability
2.9%
SELF-CARE DISABILITY
0.0/ 100
METRIC RATING
329th/ 347
METRIC RANK
Cajun Self-Care Disability Correlation Chart
The statistical analysis conducted on geographies consisting of 149,634,207 people shows a weak positive correlation between the proportion of Cajuns and percentage of population with self-care disability in the United States with a correlation coefficient (R) of 0.203 and weighted average of 2.9%. On average, for every 1% (one percent) increase in Cajuns within a typical geography, there is an increase of 0.062% in percentage of population with self-care disability.
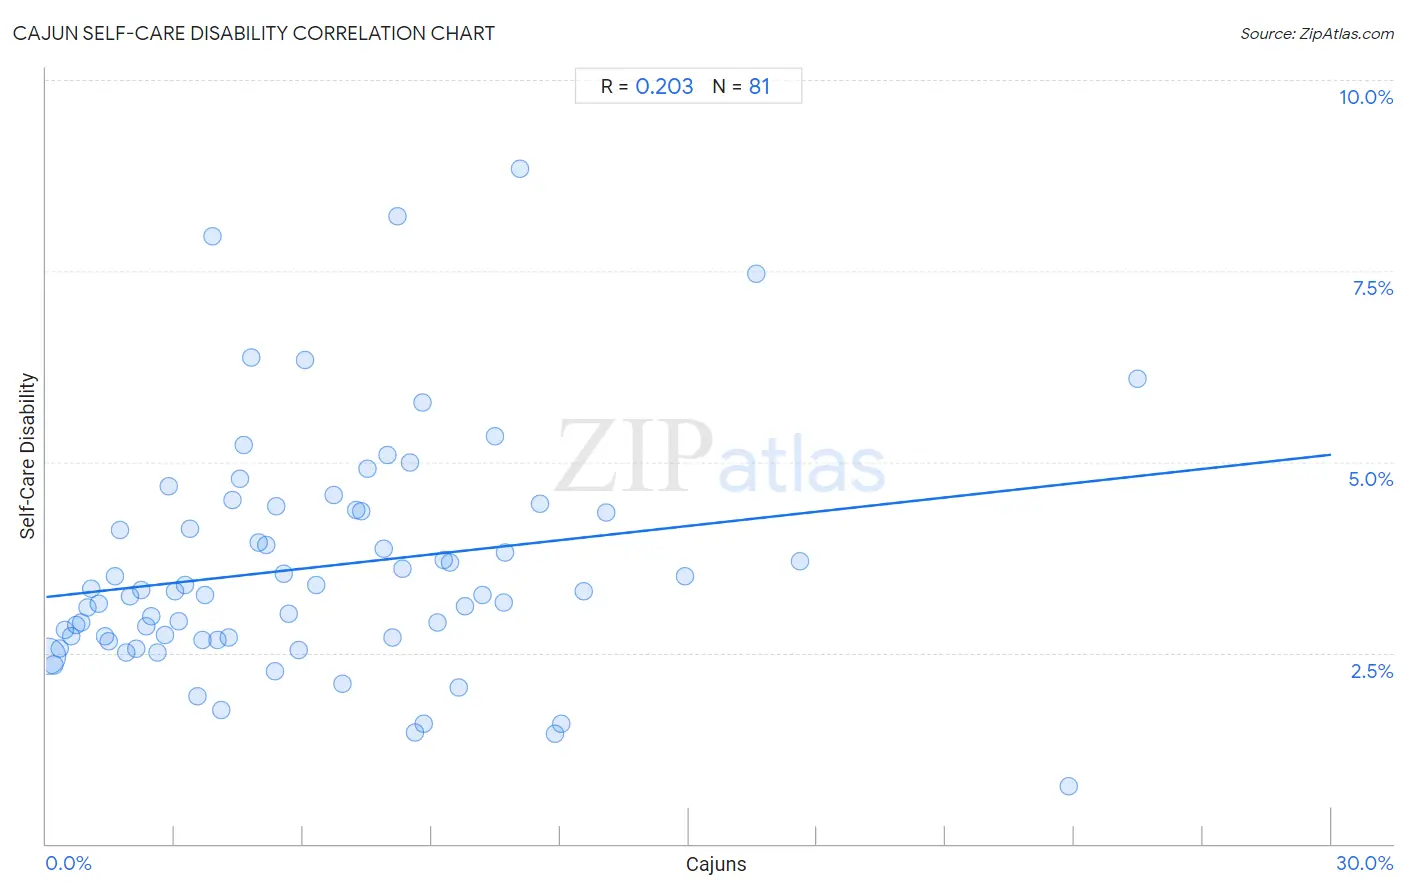
It is essential to understand that the correlation between the percentage of Cajuns and percentage of population with self-care disability does not imply a direct cause-and-effect relationship. It remains uncertain whether the presence of Cajuns influences an upward or downward trend in the level of percentage of population with self-care disability within an area, or if Cajuns simply ended up residing in those areas with higher or lower levels of percentage of population with self-care disability due to other factors.
Demographics Similar to Cajuns by Self-Care Disability
In terms of self-care disability, the demographic groups most similar to Cajuns are Hopi (2.9%, a difference of 0.21%), Black/African American (2.9%, a difference of 0.60%), Paiute (2.9%, a difference of 0.67%), Nepalese (3.0%, a difference of 0.75%), and Lumbee (3.0%, a difference of 0.87%).
| Demographics | Rating | Rank | Self-Care Disability |
| Comanche | 0.0 /100 | #322 | Tragic 2.9% |
| Seminole | 0.0 /100 | #323 | Tragic 2.9% |
| Cherokee | 0.0 /100 | #324 | Tragic 2.9% |
| Immigrants from Uzbekistan | 0.0 /100 | #325 | Tragic 2.9% |
| Paiute | 0.0 /100 | #326 | Tragic 2.9% |
| Blacks/African Americans | 0.0 /100 | #327 | Tragic 2.9% |
| Hopi | 0.0 /100 | #328 | Tragic 2.9% |
| Cajuns | 0.0 /100 | #329 | Tragic 2.9% |
| Nepalese | 0.0 /100 | #330 | Tragic 3.0% |
| Lumbee | 0.0 /100 | #331 | Tragic 3.0% |
| Kiowa | 0.0 /100 | #332 | Tragic 3.0% |
| Dutch West Indians | 0.0 /100 | #333 | Tragic 3.0% |
| Houma | 0.0 /100 | #334 | Tragic 3.0% |
| Immigrants from the Azores | 0.0 /100 | #335 | Tragic 3.0% |
| Immigrants from Yemen | 0.0 /100 | #336 | Tragic 3.0% |
Cajun Self-Care Disability Correlation Summary
| Measurement | Cajun Data | Self-Care Disability Data |
| Minimum | 0.029% | 0.75% |
| Maximum | 25.5% | 8.8% |
| Range | 25.4% | 8.1% |
| Mean | 6.3% | 3.6% |
| Median | 5.3% | 3.3% |
| Interquartile 25% (IQ1) | 2.5% | 2.7% |
| Interquartile 75% (IQ3) | 9.0% | 4.4% |
| Interquartile Range (IQR) | 6.4% | 1.7% |
| Standard Deviation (Sample) | 5.0% | 1.5% |
| Standard Deviation (Population) | 5.0% | 1.5% |
Correlation Details
| Cajun Percentile | Sample Size | Self-Care Disability |
[ 0.0% - 0.5% ] 0.029% | 130,739,211 | 2.5% |
[ 0.0% - 0.5% ] 0.18% | 9,191,130 | 2.3% |
[ 0.0% - 0.5% ] 0.31% | 3,457,534 | 2.6% |
[ 0.0% - 0.5% ] 0.44% | 1,251,368 | 2.8% |
[ 0.5% - 1.0% ] 0.57% | 866,344 | 2.7% |
[ 0.5% - 1.0% ] 0.69% | 683,235 | 2.9% |
[ 0.5% - 1.0% ] 0.81% | 508,149 | 2.9% |
[ 0.5% - 1.0% ] 0.96% | 386,782 | 3.1% |
[ 1.0% - 1.5% ] 1.06% | 348,580 | 3.3% |
[ 1.0% - 1.5% ] 1.21% | 154,562 | 3.1% |
[ 1.0% - 1.5% ] 1.36% | 139,631 | 2.7% |
[ 1.0% - 1.5% ] 1.47% | 172,414 | 2.6% |
[ 1.5% - 2.0% ] 1.61% | 126,647 | 3.5% |
[ 1.5% - 2.0% ] 1.71% | 102,631 | 4.1% |
[ 1.5% - 2.0% ] 1.86% | 152,952 | 2.5% |
[ 1.5% - 2.0% ] 1.96% | 176,067 | 3.2% |
[ 2.0% - 2.5% ] 2.09% | 132,222 | 2.6% |
[ 2.0% - 2.5% ] 2.22% | 46,990 | 3.3% |
[ 2.0% - 2.5% ] 2.33% | 70,674 | 2.8% |
[ 2.0% - 2.5% ] 2.46% | 79,335 | 3.0% |
[ 2.5% - 3.0% ] 2.61% | 115,429 | 2.5% |
[ 2.5% - 3.0% ] 2.77% | 54,387 | 2.7% |
[ 2.5% - 3.0% ] 2.86% | 8,422 | 4.7% |
[ 3.0% - 3.5% ] 3.01% | 39,411 | 3.3% |
[ 3.0% - 3.5% ] 3.09% | 99,718 | 2.9% |
[ 3.0% - 3.5% ] 3.23% | 117,306 | 3.4% |
[ 3.0% - 3.5% ] 3.37% | 60,216 | 4.1% |
[ 3.5% - 4.0% ] 3.53% | 538 | 1.9% |
[ 3.5% - 4.0% ] 3.64% | 6,211 | 2.7% |
[ 3.5% - 4.0% ] 3.71% | 18,577 | 3.3% |
[ 3.5% - 4.0% ] 3.89% | 3,417 | 7.9% |
[ 4.0% - 4.5% ] 4.01% | 31,642 | 2.7% |
[ 4.0% - 4.5% ] 4.10% | 122 | 1.8% |
[ 4.0% - 4.5% ] 4.25% | 6,498 | 2.7% |
[ 4.0% - 4.5% ] 4.36% | 734 | 4.5% |
[ 4.5% - 5.0% ] 4.51% | 27,050 | 4.8% |
[ 4.5% - 5.0% ] 4.61% | 3,794 | 5.2% |
[ 4.5% - 5.0% ] 4.79% | 13,079 | 6.4% |
[ 4.5% - 5.0% ] 4.96% | 6,507 | 3.9% |
[ 5.0% - 5.5% ] 5.13% | 19,497 | 3.9% |
[ 5.0% - 5.5% ] 5.34% | 8,745 | 2.3% |
[ 5.0% - 5.5% ] 5.38% | 2,474 | 4.4% |
[ 5.5% - 6.0% ] 5.55% | 4,162 | 3.5% |
[ 5.5% - 6.0% ] 5.66% | 7,665 | 3.0% |
[ 5.5% - 6.0% ] 5.89% | 7,606 | 2.5% |
[ 6.0% - 6.5% ] 6.03% | 9,639 | 6.3% |
[ 6.0% - 6.5% ] 6.31% | 5,516 | 3.4% |
[ 6.5% - 7.0% ] 6.72% | 16,937 | 4.6% |
[ 6.5% - 7.0% ] 6.90% | 9,823 | 2.1% |
[ 7.0% - 7.5% ] 7.22% | 12,059 | 4.4% |
[ 7.0% - 7.5% ] 7.34% | 31,076 | 4.4% |
[ 7.0% - 7.5% ] 7.50% | 4,335 | 4.9% |
[ 7.5% - 8.0% ] 7.88% | 2,437 | 3.9% |
[ 7.5% - 8.0% ] 7.95% | 1,584 | 5.1% |
[ 8.0% - 8.5% ] 8.09% | 5,528 | 2.7% |
[ 8.0% - 8.5% ] 8.21% | 134 | 8.2% |
[ 8.0% - 8.5% ] 8.32% | 2,633 | 3.6% |
[ 8.5% - 9.0% ] 8.50% | 13,329 | 5.0% |
[ 8.5% - 9.0% ] 8.60% | 2,023 | 1.5% |
[ 8.5% - 9.0% ] 8.78% | 1,766 | 5.8% |
[ 8.5% - 9.0% ] 8.81% | 885 | 1.6% |
[ 9.0% - 9.5% ] 9.13% | 241 | 2.9% |
[ 9.0% - 9.5% ] 9.29% | 915 | 3.7% |
[ 9.0% - 9.5% ] 9.43% | 23,891 | 3.7% |
[ 9.5% - 10.0% ] 9.64% | 1,473 | 2.0% |
[ 9.5% - 10.0% ] 9.78% | 1,022 | 3.1% |
[ 10.0% - 10.5% ] 10.18% | 855 | 3.3% |
[ 10.0% - 10.5% ] 10.47% | 1,518 | 5.3% |
[ 10.5% - 11.0% ] 10.69% | 8,271 | 3.2% |
[ 10.5% - 11.0% ] 10.71% | 1,046 | 3.8% |
[ 11.0% - 11.5% ] 11.06% | 5,423 | 8.8% |
[ 11.5% - 12.0% ] 11.52% | 191 | 4.5% |
[ 11.5% - 12.0% ] 11.87% | 691 | 1.4% |
[ 12.0% - 12.5% ] 12.01% | 2,215 | 1.6% |
[ 12.5% - 13.0% ] 12.55% | 1,147 | 3.3% |
[ 13.0% - 13.5% ] 13.06% | 9,326 | 4.3% |
[ 14.5% - 15.0% ] 14.92% | 1,220 | 3.5% |
[ 16.5% - 17.0% ] 16.57% | 3,338 | 7.5% |
[ 17.5% - 18.0% ] 17.59% | 216 | 3.7% |
[ 23.5% - 24.0% ] 23.87% | 398 | 0.75% |
[ 25.0% - 25.5% ] 25.47% | 1,441 | 6.1% |