Scotch-Irish Single Father Households

COMPARE

Scotch-Irish
Race
Ancestry
AfghanAfricanAlaska NativeAlaskan AthabascanAlbanianAleutAlsatianAmericanApacheArabArapahoArgentineanArmenianAssyrian/Chaldean/SyriacAustralianAustrianBahamianBangladeshiBarbadianBasqueBelgianBelizeanBermudanBhutaneseBlackfeetBolivianBrazilianBritishBritish West IndianBulgarianBurmeseCajunCambodianCanadianCape VerdeanCarpatho RusynCelticCentral AmericanCentral American IndianCherokeeCheyenneChickasawChileanChineseChippewaChoctawColombianColvilleComancheCosta RicanCreeCreekCroatianCrowCubanCypriotCzechCzechoslovakianDanishDelawareDominicanDutchDutch West IndianEastern EuropeanEcuadorianEgyptianEnglishEstonianEthiopianEuropeanFijianFilipinoFinnishFrenchFrench American IndianFrench CanadianGermanGerman RussianGhanaianGreekGuamanian/ChamorroGuatemalanGuyaneseHaitianHmongHonduranHopiHoumaHungarianIcelanderIndian (Asian)IndonesianInupiatIranianIraqiIrishIroquoisIsraeliItalianJamaicanJapaneseJordanianKenyanKiowaKoreanLaotianLatvianLebaneseLiberianLithuanianLumbeeLuxembourgerMacedonianMalaysianMalteseMarshalleseMenomineeMexicanMexican American IndianMongolianMoroccanNative HawaiianNavajoNepaleseNew ZealanderNicaraguanNigerianNorthern EuropeanNorwegianOkinawanOsageOttawaPaiutePakistaniPalestinianPanamanianParaguayanPennsylvania GermanPeruvianPimaPolishPortuguesePotawatomiPuebloPuerto RicanPuget Sound SalishRomanianRussianSalvadoranSamoanScandinavianScotch-IrishScottishSeminoleSenegaleseSerbianShoshoneSierra LeoneanSiouxSlavicSlovakSloveneSomaliSouth AfricanSouth AmericanSouth American IndianSoviet UnionSpaniardSpanishSpanish AmericanSpanish American IndianSri LankanSubsaharan AfricanSudaneseSwedishSwissSyrianTaiwaneseThaiTlingit-HaidaTohono O'OdhamTonganTrinidadian and TobagonianTsimshianTurkishU.S. Virgin IslanderUgandanUkrainianUruguayanUteVenezuelanVietnameseWelshWest IndianYakamaYaquiYugoslavianYumanYup'ikZimbabwean
Immigration
NonimmigrantsImmigrantsAfghanistanAfricaAlbaniaArgentinaArmeniaAsiaAustraliaAustriaBahamasBangladeshBarbadosBelarusBelgiumBelizeBoliviaBosnia and HerzegovinaBrazilBulgariaBurma/MyanmarCabo VerdeCambodiaCameroonCanadaCaribbeanCentral AmericaChileChinaColombiaCongoCosta RicaCroatiaCubaCzechoslovakiaDenmarkDominicaDominican RepublicEastern AfricaEastern AsiaEastern EuropeEcuadorEgyptEl SalvadorEnglandEritreaEthiopiaEuropeFijiFranceGermanyGhanaGreeceGrenadaGuatemalaGuyanaHaitiHondurasHong KongHungaryIndiaIndonesiaIranIraqIrelandIsraelItalyJamaicaJapanJordanKazakhstanKenyaKoreaKuwaitLaosLatin AmericaLatviaLebanonLiberiaLithuaniaMalaysiaMexicoMicronesiaMiddle AfricaMoldovaMoroccoNepalNetherlandsNicaraguaNigeriaNorth AmericaNorth MacedoniaNorthern AfricaNorthern EuropeNorwayOceaniaPakistanPanamaPeruPhilippinesPolandPortugalRomaniaRussiaSaudi ArabiaScotlandSenegalSerbiaSierra LeoneSingaporeSomaliaSouth AfricaSouth AmericaSouth Central AsiaSouth Eastern AsiaSouthern EuropeSpainSri LankaSt. Vincent and the GrenadinesSudanSwedenSwitzerlandSyriaTaiwanThailandTrinidad and TobagoTurkeyUgandaUkraineUruguayUzbekistanVenezuelaVietnamWest IndiesWestern AfricaWestern AsiaWestern EuropeYemenZaireZimbabweAzores
Select to Compare
Race
Ancestry
AfghanAfricanAlaska NativeAlaskan AthabascanAlbanianAleutAlsatianAmericanApacheArabArapahoArgentineanArmenianAssyrian/Chaldean/SyriacAustralianAustrianBahamianBangladeshiBarbadianBasqueBelgianBelizeanBermudanBhutaneseBlackfeetBolivianBrazilianBritishBritish West IndianBulgarianBurmeseCajunCambodianCanadianCape VerdeanCarpatho RusynCelticCentral AmericanCentral American IndianCherokeeCheyenneChickasawChileanChineseChippewaChoctawColombianColvilleComancheCosta RicanCreeCreekCroatianCrowCubanCypriotCzechCzechoslovakianDanishDelawareDominicanDutchDutch West IndianEastern EuropeanEcuadorianEgyptianEnglishEstonianEthiopianEuropeanFijianFilipinoFinnishFrenchFrench American IndianFrench CanadianGermanGerman RussianGhanaianGreekGuamanian/ChamorroGuatemalanGuyaneseHaitianHmongHonduranHopiHoumaHungarianIcelanderIndian (Asian)IndonesianInupiatIranianIraqiIrishIroquoisIsraeliItalianJamaicanJapaneseJordanianKenyanKiowaKoreanLaotianLatvianLebaneseLiberianLithuanianLumbeeLuxembourgerMacedonianMalaysianMalteseMarshalleseMenomineeMexicanMexican American IndianMongolianMoroccanNative HawaiianNavajoNepaleseNew ZealanderNicaraguanNigerianNorthern EuropeanNorwegianOkinawanOsageOttawaPaiutePakistaniPalestinianPanamanianParaguayanPennsylvania GermanPeruvianPimaPolishPortuguesePotawatomiPuebloPuerto RicanPuget Sound SalishRomanianRussianSalvadoranSamoanScandinavianScottishSeminoleSenegaleseSerbianShoshoneSierra LeoneanSiouxSlavicSlovakSloveneSomaliSouth AfricanSouth AmericanSouth American IndianSoviet UnionSpaniardSpanishSpanish AmericanSpanish American IndianSri LankanSubsaharan AfricanSudaneseSwedishSwissSyrianTaiwaneseThaiTlingit-HaidaTohono O'OdhamTonganTrinidadian and TobagonianTsimshianTurkishU.S. Virgin IslanderUgandanUkrainianUruguayanUteVenezuelanVietnameseWelshWest IndianYakamaYaquiYugoslavianYumanYup'ikZimbabwean
Immigration
NonimmigrantsImmigrantsAfghanistanAfricaAlbaniaArgentinaArmeniaAsiaAustraliaAustriaBahamasBangladeshBarbadosBelarusBelgiumBelizeBoliviaBosnia and HerzegovinaBrazilBulgariaBurma/MyanmarCabo VerdeCambodiaCameroonCanadaCaribbeanCentral AmericaChileChinaColombiaCongoCosta RicaCroatiaCubaCzechoslovakiaDenmarkDominicaDominican RepublicEastern AfricaEastern AsiaEastern EuropeEcuadorEgyptEl SalvadorEnglandEritreaEthiopiaEuropeFijiFranceGermanyGhanaGreeceGrenadaGuatemalaGuyanaHaitiHondurasHong KongHungaryIndiaIndonesiaIranIraqIrelandIsraelItalyJamaicaJapanJordanKazakhstanKenyaKoreaKuwaitLaosLatin AmericaLatviaLebanonLiberiaLithuaniaMalaysiaMexicoMicronesiaMiddle AfricaMoldovaMoroccoNepalNetherlandsNicaraguaNigeriaNorth AmericaNorth MacedoniaNorthern AfricaNorthern EuropeNorwayOceaniaPakistanPanamaPeruPhilippinesPolandPortugalRomaniaRussiaSaudi ArabiaScotlandSenegalSerbiaSierra LeoneSingaporeSomaliaSouth AfricaSouth AmericaSouth Central AsiaSouth Eastern AsiaSouthern EuropeSpainSri LankaSt. Vincent and the GrenadinesSudanSwedenSwitzerlandSyriaTaiwanThailandTrinidad and TobagoTurkeyUgandaUkraineUruguayUzbekistanVenezuelaVietnamWest IndiesWestern AfricaWestern AsiaWestern EuropeYemenZaireZimbabweAzores
Single Father Households
Income
Poverty
Unemployment
Labor Participation
Family Structure
Vehicle Availability
Education Level
Disability

Scotch-Irish Single Father Households
Good

2.3%
SINGLE FATHER HOUSEHOLDS
69.4/ 100
METRIC RATING
165th/ 347
METRIC RANK

Scotch-Irish Single Father Households Correlation Chart

The statistical analysis conducted on geographies consisting of 535,957,408 people shows a weak positive correlation between the proportion of Scotch-Irish and percentage of single father households in the United States with a correlation coefficient (R) of 0.232 and weighted average of 2.3%. On average, for every 1% (one percent) increase in Scotch-Irish within a typical geography, there is an increase of 0.072% in percentage of single father households.
Scotch-Irish Single Father Households
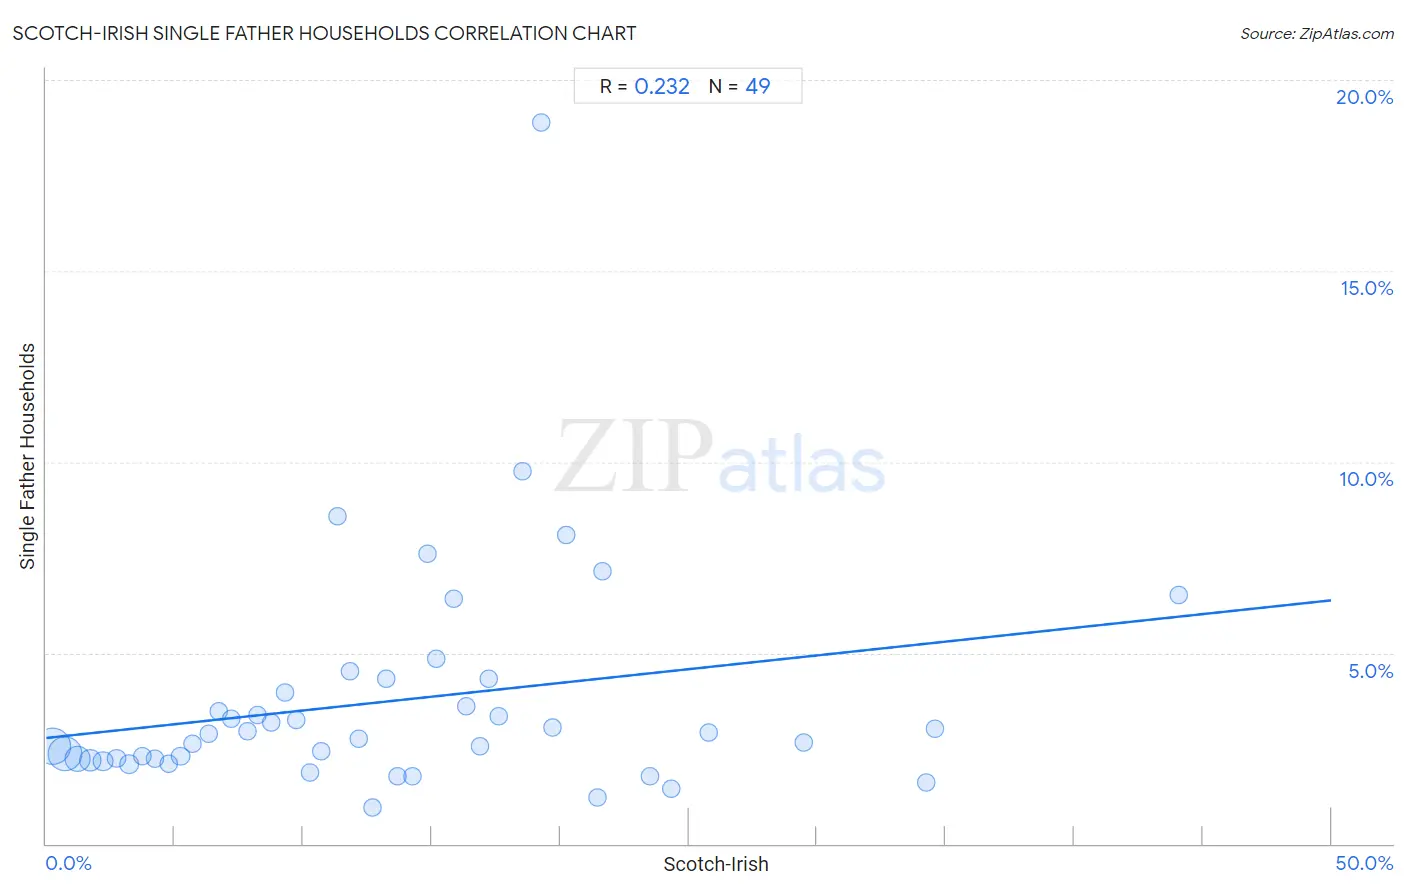
It is essential to understand that the correlation between the percentage of Scotch-Irish and percentage of single father households does not imply a direct cause-and-effect relationship. It remains uncertain whether the presence of Scotch-Irish influences an upward or downward trend in the level of percentage of single father households within an area, or if Scotch-Irish simply ended up residing in those areas with higher or lower levels of percentage of single father households due to other factors.

Demographics Similar to Scotch-Irish by Single Father Households

In terms of single father households, the demographic groups most similar to Scotch-Irish are English (2.3%, a difference of 0.070%), Pakistani (2.3%, a difference of 0.10%), Irish (2.3%, a difference of 0.24%), Scottish (2.3%, a difference of 0.31%), and Swiss (2.3%, a difference of 0.35%).
DemographicsRating | RankSingle Father Households
Immigrants from Senegal
79.4
/100
|
#158
Good
2.3%
Immigrants from West Indies
77.9
/100
|
#159
Good
2.3%
Immigrants from Bolivia
76.3
/100
|
#160
Good
2.3%
Swiss
73.2
/100
|
#161
Good
2.3%
Scottish
72.8
/100
|
#162
Good
2.3%
Irish
72.1
/100
|
#163
Good
2.3%
Pakistanis
70.6
/100
|
#164
Good
2.3%
Scotch-Irish
69.4
/100
|
#165
Good
2.3%
English
68.6
/100
|
#166
Good
2.3%
South Americans
64.3
/100
|
#167
Good
2.3%
Icelanders
63.1
/100
|
#168
Good
2.3%
Czechs
62.5
/100
|
#169
Good
2.3%
Ugandans
62.2
/100
|
#170
Good
2.3%
Swedes
61.6
/100
|
#171
Good
2.3%
Czechoslovakians
58.9
/100
|
#172
Average
2.3%

Scotch-Irish Single Father Households Correlation Summary

MeasurementScotch-Irish DataSingle Father Households Data
Minimum0.25%0.96%
Maximum44.1%18.9%
Range43.8%17.9%
Mean13.5%3.7%
Median12.2%2.9%
Interquartile 25% (IQ1)6.0%2.2%
Interquartile 75% (IQ3)18.9%4.1%
Interquartile Range (IQR)12.9%1.9%
Standard Deviation (Sample)9.6%3.0%
Standard Deviation (Population)9.5%3.0%

Correlation Details

Scotch-Irish PercentileSample SizeSingle Father Households
[
0.0%
-
0.5%
]
0.25%
207,646,8052.6%
[
0.5%
-
1.0%
]
0.72%
179,887,0442.4%
[
1.0%
-
1.5%
]
1.21%
80,726,8492.2%
[
1.5%
-
2.0%
]
1.71%
35,185,3772.2%
[
2.0%
-
2.5%
]
2.21%
15,123,7132.2%
[
2.5%
-
3.0%
]
2.73%
7,270,6792.2%
[
3.0%
-
3.5%
]
3.23%
4,742,3762.1%
[
3.5%
-
4.0%
]
3.75%
2,224,7532.3%
[
4.0%
-
4.5%
]
4.25%
1,105,6162.2%
[
4.5%
-
5.0%
]
4.76%
608,4322.1%
[
5.0%
-
5.5%
]
5.23%
540,5542.3%
[
5.5%
-
6.0%
]
5.71%
254,2312.6%
[
6.0%
-
6.5%
]
6.31%
151,0462.9%
[
6.5%
-
7.0%
]
6.72%
81,4823.5%
[
7.0%
-
7.5%
]
7.20%
67,2553.3%
[
7.5%
-
8.0%
]
7.81%
74,4232.9%
[
8.0%
-
8.5%
]
8.20%
49,0933.4%
[
8.5%
-
9.0%
]
8.76%
50,0013.2%
[
9.0%
-
9.5%
]
9.29%
19,6204.0%
[
9.5%
-
10.0%
]
9.70%
18,7663.3%
[
10.0%
-
10.5%
]
10.25%
24,4131.9%
[
10.5%
-
11.0%
]
10.69%
16,9472.4%
[
11.0%
-
11.5%
]
11.31%
4,3938.6%
[
11.5%
-
12.0%
]
11.83%
7,4874.5%
[
12.0%
-
12.5%
]
12.17%
4,4222.8%
[
12.5%
-
13.0%
]
12.69%
1,5760.96%
[
13.0%
-
13.5%
]
13.21%
17,2384.3%
[
13.5%
-
14.0%
]
13.64%
8,4721.8%
[
14.0%
-
14.5%
]
14.25%
12,9261.8%
[
14.5%
-
15.0%
]
14.85%
5867.6%
[
15.0%
-
15.5%
]
15.16%
3,8594.9%
[
15.5%
-
16.0%
]
15.88%
3,3256.4%
[
16.0%
-
16.5%
]
16.33%
4,6043.6%
[
16.5%
-
17.0%
]
16.89%
3,5052.5%
[
17.0%
-
17.5%
]
17.22%
3,3974.3%
[
17.5%
-
18.0%
]
17.60%
6,3233.3%
[
18.5%
-
19.0%
]
18.55%
2759.8%
[
19.0%
-
19.5%
]
19.26%
29618.9%
[
19.5%
-
20.0%
]
19.71%
9743.1%
[
20.0%
-
20.5%
]
20.22%
4558.1%
[
21.0%
-
21.5%
]
21.47%
3681.2%
[
21.5%
-
22.0%
]
21.67%
6007.1%
[
23.0%
-
23.5%
]
23.48%
9031.8%
[
24.0%
-
24.5%
]
24.34%
1891.4%
[
25.5%
-
26.0%
]
25.79%
5702.9%
[
29.0%
-
29.5%
]
29.49%
2172.7%
[
34.0%
-
34.5%
]
34.22%
4501.6%
[
34.5%
-
35.0%
]
34.59%
1853.0%
[
44.0%
-
44.5%
]
44.08%
3386.5%