Immigrants from Taiwan Self-Care Disability
COMPARE
Immigrants from Taiwan
Select to Compare
Self-Care Disability
Immigrants from Taiwan Self-Care Disability
2.2%
SELF-CARE DISABILITY
100.0/ 100
METRIC RATING
18th/ 347
METRIC RANK
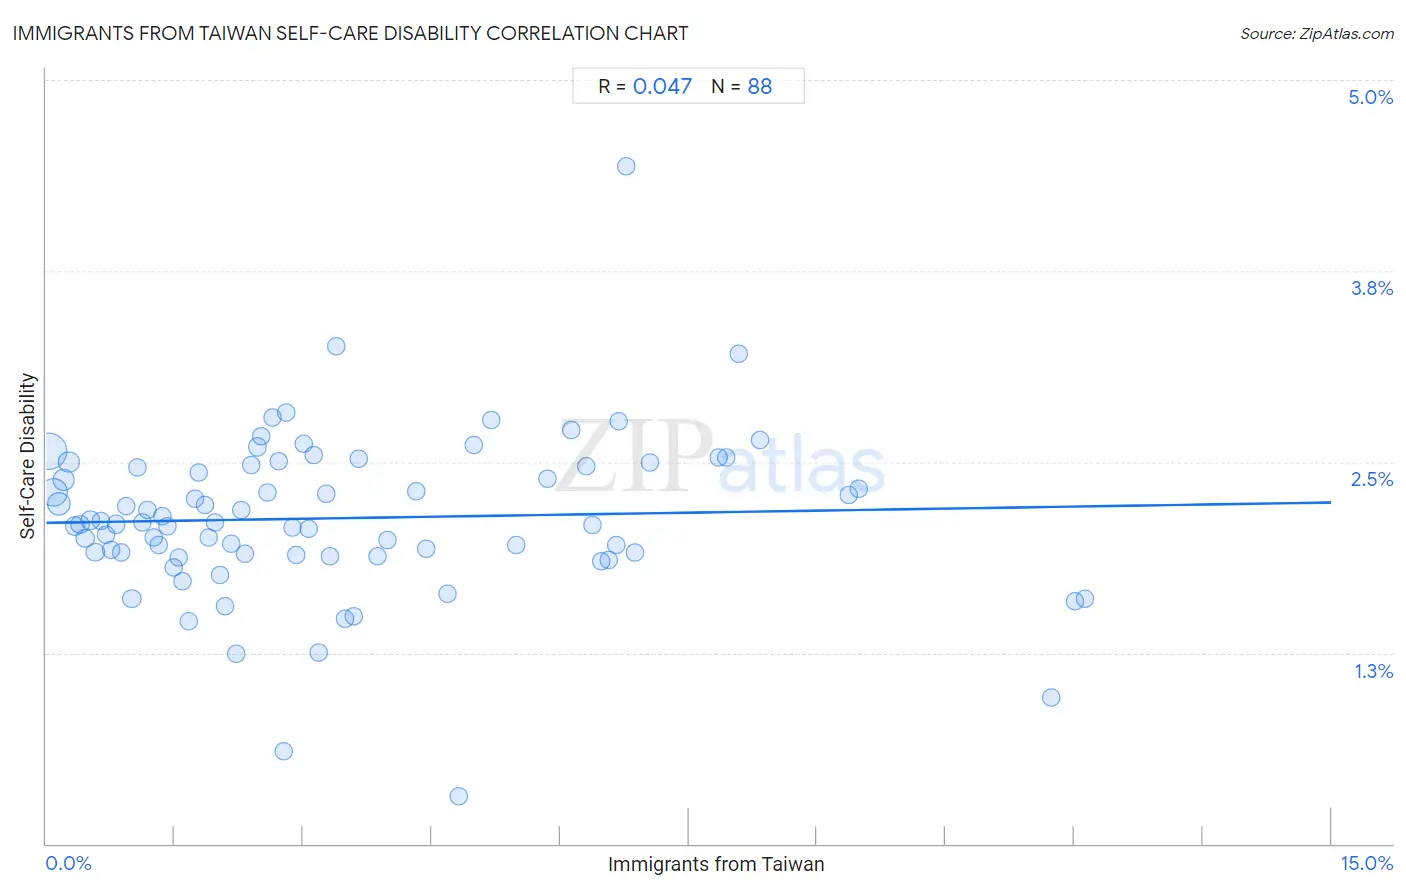
Immigrants from Taiwan Self-Care Disability Correlation Chart
The statistical analysis conducted on geographies consisting of 297,966,372 people shows no correlation between the proportion of Immigrants from Taiwan and percentage of population with self-care disability in the United States with a correlation coefficient (R) of 0.047 and weighted average of 2.2%. On average, for every 1% (one percent) increase in Immigrants from Taiwan within a typical geography, there is an increase of 0.0089% in percentage of population with self-care disability.
It is essential to understand that the correlation between the percentage of Immigrants from Taiwan and percentage of population with self-care disability does not imply a direct cause-and-effect relationship. It remains uncertain whether the presence of Immigrants from Taiwan influences an upward or downward trend in the level of percentage of population with self-care disability within an area, or if Immigrants from Taiwan simply ended up residing in those areas with higher or lower levels of percentage of population with self-care disability due to other factors.
Demographics Similar to Immigrants from Taiwan by Self-Care Disability
In terms of self-care disability, the demographic groups most similar to Immigrants from Taiwan are Immigrants from Saudi Arabia (2.2%, a difference of 0.25%), Immigrants from Eritrea (2.2%, a difference of 0.33%), Tongan (2.2%, a difference of 0.41%), Immigrants from Kuwait (2.2%, a difference of 0.42%), and Bulgarian (2.2%, a difference of 0.66%).
| Demographics | Rating | Rank | Self-Care Disability |
| Immigrants from South Central Asia | 100.0 /100 | #11 | Exceptional 2.2% |
| Immigrants from Ethiopia | 100.0 /100 | #12 | Exceptional 2.2% |
| Ethiopians | 100.0 /100 | #13 | Exceptional 2.2% |
| Luxembourgers | 100.0 /100 | #14 | Exceptional 2.2% |
| Okinawans | 100.0 /100 | #15 | Exceptional 2.2% |
| Immigrants from Kuwait | 100.0 /100 | #16 | Exceptional 2.2% |
| Immigrants from Saudi Arabia | 100.0 /100 | #17 | Exceptional 2.2% |
| Immigrants from Taiwan | 100.0 /100 | #18 | Exceptional 2.2% |
| Immigrants from Eritrea | 100.0 /100 | #19 | Exceptional 2.2% |
| Tongans | 100.0 /100 | #20 | Exceptional 2.2% |
| Bulgarians | 100.0 /100 | #21 | Exceptional 2.2% |
| Immigrants from Venezuela | 100.0 /100 | #22 | Exceptional 2.2% |
| Cambodians | 100.0 /100 | #23 | Exceptional 2.2% |
| Cypriots | 100.0 /100 | #24 | Exceptional 2.2% |
| Turks | 100.0 /100 | #25 | Exceptional 2.2% |
Immigrants from Taiwan Self-Care Disability Correlation Summary
| Measurement | Immigrants from Taiwan Data | Self-Care Disability Data |
| Minimum | 0.032% | 0.31% |
| Maximum | 12.1% | 4.4% |
| Range | 12.1% | 4.1% |
| Mean | 3.5% | 2.1% |
| Median | 2.7% | 2.1% |
| Interquartile 25% (IQ1) | 1.3% | 1.9% |
| Interquartile 75% (IQ3) | 5.1% | 2.5% |
| Interquartile Range (IQR) | 3.8% | 0.58% |
| Standard Deviation (Sample) | 2.9% | 0.54% |
| Standard Deviation (Population) | 2.9% | 0.54% |
Correlation Details
| Immigrants from Taiwan Percentile | Sample Size | Self-Care Disability |
[ 0.0% - 0.5% ] 0.032% | 111,291,632 | 2.6% |
[ 0.0% - 0.5% ] 0.084% | 60,929,472 | 2.3% |
[ 0.0% - 0.5% ] 0.15% | 28,332,638 | 2.2% |
[ 0.0% - 0.5% ] 0.21% | 23,669,005 | 2.4% |
[ 0.0% - 0.5% ] 0.26% | 20,867,110 | 2.5% |
[ 0.0% - 0.5% ] 0.33% | 9,708,125 | 2.1% |
[ 0.0% - 0.5% ] 0.39% | 6,467,573 | 2.1% |
[ 0.0% - 0.5% ] 0.46% | 4,468,688 | 2.0% |
[ 0.5% - 1.0% ] 0.51% | 3,765,286 | 2.1% |
[ 0.5% - 1.0% ] 0.58% | 4,017,736 | 1.9% |
[ 0.5% - 1.0% ] 0.64% | 3,497,038 | 2.1% |
[ 0.5% - 1.0% ] 0.70% | 2,491,359 | 2.0% |
[ 0.5% - 1.0% ] 0.76% | 1,657,418 | 1.9% |
[ 0.5% - 1.0% ] 0.82% | 1,390,257 | 2.1% |
[ 0.5% - 1.0% ] 0.88% | 1,193,432 | 1.9% |
[ 0.5% - 1.0% ] 0.94% | 1,135,011 | 2.2% |
[ 0.5% - 1.0% ] 1.00% | 908,107 | 1.6% |
[ 1.0% - 1.5% ] 1.06% | 1,030,169 | 2.5% |
[ 1.0% - 1.5% ] 1.12% | 767,844 | 2.1% |
[ 1.0% - 1.5% ] 1.18% | 767,757 | 2.2% |
[ 1.0% - 1.5% ] 1.25% | 585,778 | 2.0% |
[ 1.0% - 1.5% ] 1.31% | 161,280 | 2.0% |
[ 1.0% - 1.5% ] 1.35% | 1,684,286 | 2.1% |
[ 1.0% - 1.5% ] 1.42% | 232,124 | 2.1% |
[ 1.0% - 1.5% ] 1.48% | 497,074 | 1.8% |
[ 1.5% - 2.0% ] 1.54% | 657,037 | 1.9% |
[ 1.5% - 2.0% ] 1.59% | 106,109 | 1.7% |
[ 1.5% - 2.0% ] 1.67% | 259,288 | 1.5% |
[ 1.5% - 2.0% ] 1.74% | 104,480 | 2.3% |
[ 1.5% - 2.0% ] 1.78% | 57,202 | 2.4% |
[ 1.5% - 2.0% ] 1.86% | 408,287 | 2.2% |
[ 1.5% - 2.0% ] 1.90% | 268,133 | 2.0% |
[ 1.5% - 2.0% ] 1.97% | 610,486 | 2.1% |
[ 2.0% - 2.5% ] 2.02% | 99,729 | 1.8% |
[ 2.0% - 2.5% ] 2.09% | 197,657 | 1.6% |
[ 2.0% - 2.5% ] 2.15% | 139,155 | 2.0% |
[ 2.0% - 2.5% ] 2.22% | 68,508 | 1.2% |
[ 2.0% - 2.5% ] 2.28% | 96,497 | 2.2% |
[ 2.0% - 2.5% ] 2.32% | 425,680 | 1.9% |
[ 2.0% - 2.5% ] 2.39% | 48,030 | 2.5% |
[ 2.0% - 2.5% ] 2.47% | 287,905 | 2.6% |
[ 2.5% - 3.0% ] 2.51% | 102,158 | 2.7% |
[ 2.5% - 3.0% ] 2.58% | 198,983 | 2.3% |
[ 2.5% - 3.0% ] 2.64% | 114,547 | 2.8% |
[ 2.5% - 3.0% ] 2.71% | 77,540 | 2.5% |
[ 2.5% - 3.0% ] 2.78% | 11,994 | 0.61% |
[ 2.5% - 3.0% ] 2.80% | 172,086 | 2.8% |
[ 2.5% - 3.0% ] 2.88% | 38,903 | 2.1% |
[ 2.5% - 3.0% ] 2.91% | 212,221 | 1.9% |
[ 3.0% - 3.5% ] 3.00% | 63,649 | 2.6% |
[ 3.0% - 3.5% ] 3.06% | 273,341 | 2.1% |
[ 3.0% - 3.5% ] 3.13% | 46,906 | 2.5% |
[ 3.0% - 3.5% ] 3.18% | 7,559 | 1.3% |
[ 3.0% - 3.5% ] 3.27% | 948 | 2.3% |
[ 3.0% - 3.5% ] 3.31% | 17,826 | 1.9% |
[ 3.0% - 3.5% ] 3.39% | 52,587 | 3.3% |
[ 3.0% - 3.5% ] 3.49% | 24,692 | 1.5% |
[ 3.5% - 4.0% ] 3.59% | 61,940 | 1.5% |
[ 3.5% - 4.0% ] 3.64% | 40,981 | 2.5% |
[ 3.5% - 4.0% ] 3.86% | 20,442 | 1.9% |
[ 3.5% - 4.0% ] 3.98% | 5,170 | 2.0% |
[ 4.0% - 4.5% ] 4.31% | 1,577 | 2.3% |
[ 4.0% - 4.5% ] 4.44% | 31,335 | 1.9% |
[ 4.5% - 5.0% ] 4.69% | 8,362 | 1.6% |
[ 4.5% - 5.0% ] 4.81% | 2,890 | 0.31% |
[ 4.5% - 5.0% ] 4.99% | 98,350 | 2.6% |
[ 5.0% - 5.5% ] 5.19% | 8,441 | 2.8% |
[ 5.0% - 5.5% ] 5.48% | 62,451 | 2.0% |
[ 5.5% - 6.0% ] 5.85% | 35,556 | 2.4% |
[ 6.0% - 6.5% ] 6.13% | 767 | 2.7% |
[ 6.0% - 6.5% ] 6.31% | 36,909 | 2.5% |
[ 6.0% - 6.5% ] 6.38% | 31,688 | 2.1% |
[ 6.0% - 6.5% ] 6.47% | 61,414 | 1.8% |
[ 6.5% - 7.0% ] 6.57% | 4,463 | 1.9% |
[ 6.5% - 7.0% ] 6.65% | 90,534 | 2.0% |
[ 6.5% - 7.0% ] 6.69% | 110,950 | 2.8% |
[ 6.5% - 7.0% ] 6.76% | 33,367 | 4.4% |
[ 6.5% - 7.0% ] 6.88% | 53,464 | 1.9% |
[ 7.0% - 7.5% ] 7.04% | 24,169 | 2.5% |
[ 7.5% - 8.0% ] 7.85% | 73,363 | 2.5% |
[ 7.5% - 8.0% ] 7.94% | 54,534 | 2.5% |
[ 8.0% - 8.5% ] 8.09% | 84,393 | 3.2% |
[ 8.0% - 8.5% ] 8.33% | 45,303 | 2.6% |
[ 9.0% - 9.5% ] 9.37% | 43,851 | 2.3% |
[ 9.0% - 9.5% ] 9.48% | 47,209 | 2.3% |
[ 11.5% - 12.0% ] 11.73% | 1,176 | 0.96% |
[ 12.0% - 12.5% ] 12.01% | 12,559 | 1.6% |
[ 12.0% - 12.5% ] 12.12% | 12,442 | 1.6% |