Immigrants from Lebanon Self-Care Disability
COMPARE
Immigrants from Lebanon
Select to Compare
Self-Care Disability
Immigrants from Lebanon Self-Care Disability
2.5%
SELF-CARE DISABILITY
12.4/ 100
METRIC RATING
203rd/ 347
METRIC RANK
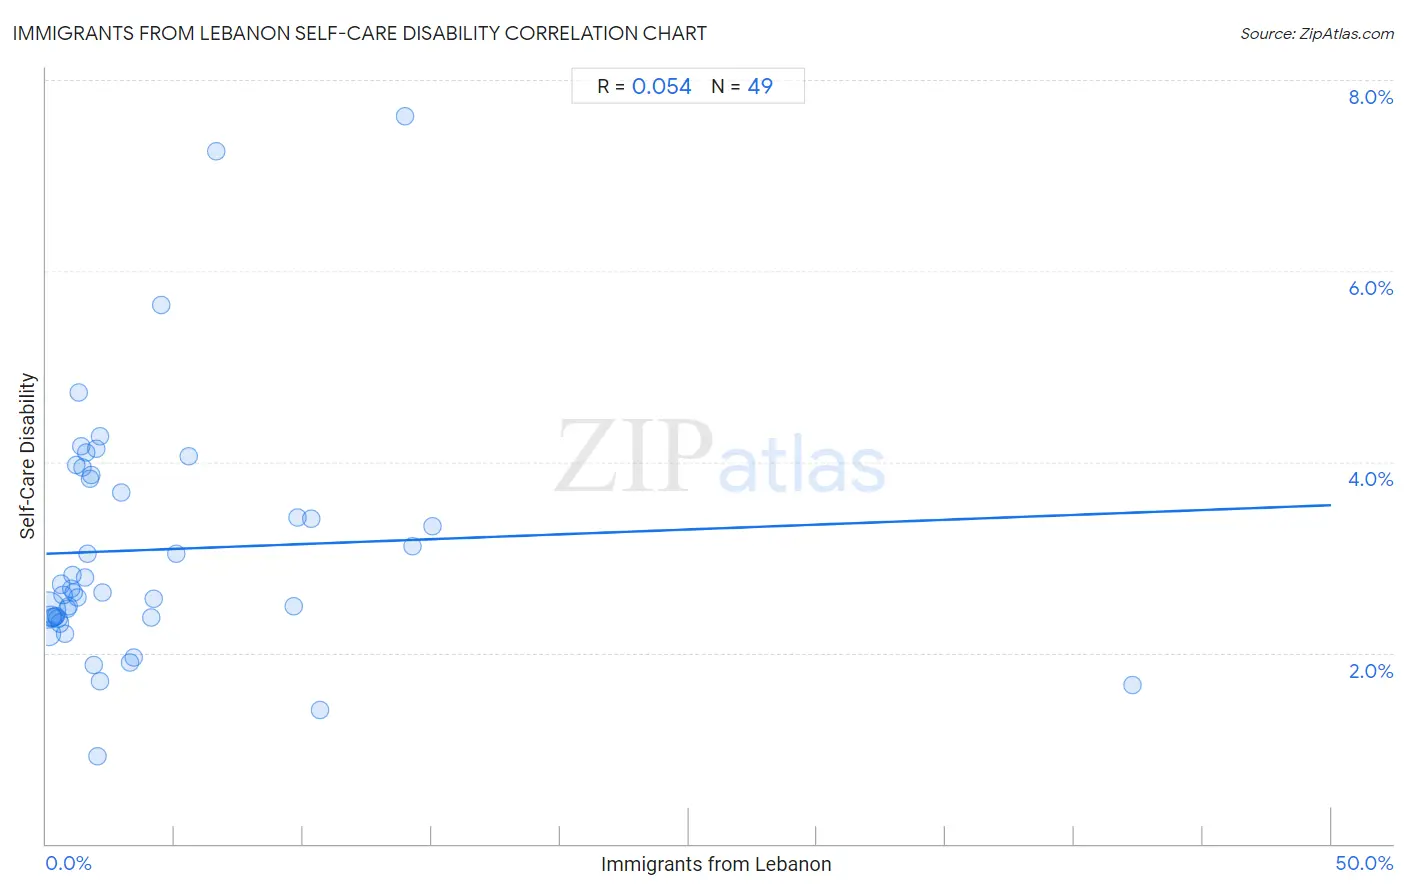
Immigrants from Lebanon Self-Care Disability Correlation Chart
The statistical analysis conducted on geographies consisting of 217,055,251 people shows a slight positive correlation between the proportion of Immigrants from Lebanon and percentage of population with self-care disability in the United States with a correlation coefficient (R) of 0.054 and weighted average of 2.5%. On average, for every 1% (one percent) increase in Immigrants from Lebanon within a typical geography, there is an increase of 0.010% in percentage of population with self-care disability.
It is essential to understand that the correlation between the percentage of Immigrants from Lebanon and percentage of population with self-care disability does not imply a direct cause-and-effect relationship. It remains uncertain whether the presence of Immigrants from Lebanon influences an upward or downward trend in the level of percentage of population with self-care disability within an area, or if Immigrants from Lebanon simply ended up residing in those areas with higher or lower levels of percentage of population with self-care disability due to other factors.
Demographics Similar to Immigrants from Lebanon by Self-Care Disability
In terms of self-care disability, the demographic groups most similar to Immigrants from Lebanon are Slovak (2.5%, a difference of 0.020%), Immigrants from South Eastern Asia (2.5%, a difference of 0.050%), Immigrants from Bahamas (2.5%, a difference of 0.050%), Immigrants from Western Africa (2.5%, a difference of 0.090%), and Immigrants from Russia (2.5%, a difference of 0.15%).
| Demographics | Rating | Rank | Self-Care Disability |
| Koreans | 15.5 /100 | #196 | Poor 2.5% |
| Crow | 15.2 /100 | #197 | Poor 2.5% |
| Immigrants | 15.0 /100 | #198 | Poor 2.5% |
| Immigrants from Ghana | 14.7 /100 | #199 | Poor 2.5% |
| Immigrants from Western Africa | 13.3 /100 | #200 | Poor 2.5% |
| Immigrants from South Eastern Asia | 12.9 /100 | #201 | Poor 2.5% |
| Slovaks | 12.6 /100 | #202 | Poor 2.5% |
| Immigrants from Lebanon | 12.4 /100 | #203 | Poor 2.5% |
| Immigrants from Bahamas | 11.9 /100 | #204 | Poor 2.5% |
| Immigrants from Russia | 11.0 /100 | #205 | Poor 2.5% |
| Alaskan Athabascans | 10.4 /100 | #206 | Poor 2.5% |
| French | 9.9 /100 | #207 | Tragic 2.5% |
| Central Americans | 8.7 /100 | #208 | Tragic 2.5% |
| Malaysians | 7.7 /100 | #209 | Tragic 2.5% |
| Panamanians | 6.4 /100 | #210 | Tragic 2.5% |
Immigrants from Lebanon Self-Care Disability Correlation Summary
| Measurement | Immigrants from Lebanon Data | Self-Care Disability Data |
| Minimum | 0.032% | 0.92% |
| Maximum | 42.3% | 7.6% |
| Range | 42.2% | 6.7% |
| Mean | 4.1% | 3.1% |
| Median | 1.7% | 2.6% |
| Interquartile 25% (IQ1) | 0.84% | 2.4% |
| Interquartile 75% (IQ3) | 4.3% | 3.8% |
| Interquartile Range (IQR) | 3.5% | 1.5% |
| Standard Deviation (Sample) | 6.8% | 1.3% |
| Standard Deviation (Population) | 6.7% | 1.3% |
Correlation Details
| Immigrants from Lebanon Percentile | Sample Size | Self-Care Disability |
[ 0.0% - 0.5% ] 0.032% | 132,049,368 | 2.5% |
[ 0.0% - 0.5% ] 0.096% | 44,558,780 | 2.2% |
[ 0.0% - 0.5% ] 0.17% | 18,030,668 | 2.4% |
[ 0.0% - 0.5% ] 0.24% | 7,612,337 | 2.4% |
[ 0.0% - 0.5% ] 0.31% | 4,211,343 | 2.4% |
[ 0.0% - 0.5% ] 0.38% | 2,701,439 | 2.4% |
[ 0.0% - 0.5% ] 0.46% | 1,649,600 | 2.4% |
[ 0.5% - 1.0% ] 0.53% | 1,519,817 | 2.3% |
[ 0.5% - 1.0% ] 0.59% | 1,237,418 | 2.7% |
[ 0.5% - 1.0% ] 0.66% | 491,939 | 2.6% |
[ 0.5% - 1.0% ] 0.73% | 224,378 | 2.2% |
[ 0.5% - 1.0% ] 0.82% | 337,554 | 2.5% |
[ 0.5% - 1.0% ] 0.87% | 396,072 | 2.5% |
[ 0.5% - 1.0% ] 0.95% | 405,050 | 2.7% |
[ 1.0% - 1.5% ] 1.00% | 135,135 | 2.8% |
[ 1.0% - 1.5% ] 1.09% | 243,728 | 2.6% |
[ 1.0% - 1.5% ] 1.15% | 32,927 | 4.0% |
[ 1.0% - 1.5% ] 1.23% | 210,378 | 2.6% |
[ 1.0% - 1.5% ] 1.27% | 358,285 | 4.7% |
[ 1.0% - 1.5% ] 1.38% | 71,971 | 4.2% |
[ 1.0% - 1.5% ] 1.43% | 29,065 | 3.9% |
[ 1.0% - 1.5% ] 1.49% | 33,278 | 2.8% |
[ 1.5% - 2.0% ] 1.57% | 3,450 | 4.1% |
[ 1.5% - 2.0% ] 1.63% | 6,083 | 3.0% |
[ 1.5% - 2.0% ] 1.70% | 23,589 | 3.8% |
[ 1.5% - 2.0% ] 1.76% | 43,412 | 3.9% |
[ 1.5% - 2.0% ] 1.87% | 20,371 | 1.9% |
[ 1.5% - 2.0% ] 1.93% | 35,408 | 4.1% |
[ 1.5% - 2.0% ] 1.98% | 6,260 | 0.92% |
[ 2.0% - 2.5% ] 2.09% | 24,229 | 1.7% |
[ 2.0% - 2.5% ] 2.11% | 15,377 | 4.3% |
[ 2.0% - 2.5% ] 2.20% | 3,544 | 2.6% |
[ 2.5% - 3.0% ] 2.93% | 205 | 3.7% |
[ 3.0% - 3.5% ] 3.26% | 2,025 | 1.9% |
[ 3.0% - 3.5% ] 3.42% | 34,046 | 2.0% |
[ 4.0% - 4.5% ] 4.08% | 8,919 | 2.4% |
[ 4.0% - 4.5% ] 4.17% | 2,589 | 2.6% |
[ 4.0% - 4.5% ] 4.46% | 1,501 | 5.6% |
[ 5.0% - 5.5% ] 5.04% | 1,945 | 3.0% |
[ 5.5% - 6.0% ] 5.54% | 3,252 | 4.1% |
[ 6.5% - 7.0% ] 6.61% | 469 | 7.2% |
[ 9.5% - 10.0% ] 9.61% | 108,414 | 2.5% |
[ 9.5% - 10.0% ] 9.79% | 429 | 3.4% |
[ 10.0% - 10.5% ] 10.31% | 62,474 | 3.4% |
[ 10.5% - 11.0% ] 10.66% | 12,405 | 1.4% |
[ 13.5% - 14.0% ] 13.97% | 229 | 7.6% |
[ 14.0% - 14.5% ] 14.27% | 53,044 | 3.1% |
[ 15.0% - 15.5% ] 15.03% | 40,392 | 3.3% |
[ 42.0% - 42.5% ] 42.27% | 660 | 1.7% |