Portuguese Self-Care Disability
COMPARE
Portuguese
Select to Compare
Self-Care Disability
Portuguese Self-Care Disability
2.6%
SELF-CARE DISABILITY
0.4/ 100
METRIC RATING
250th/ 347
METRIC RANK
Portuguese Self-Care Disability Correlation Chart
The statistical analysis conducted on geographies consisting of 449,515,942 people shows a substantial positive correlation between the proportion of Portuguese and percentage of population with self-care disability in the United States with a correlation coefficient (R) of 0.574 and weighted average of 2.6%. On average, for every 1% (one percent) increase in Portuguese within a typical geography, there is an increase of 0.051% in percentage of population with self-care disability.
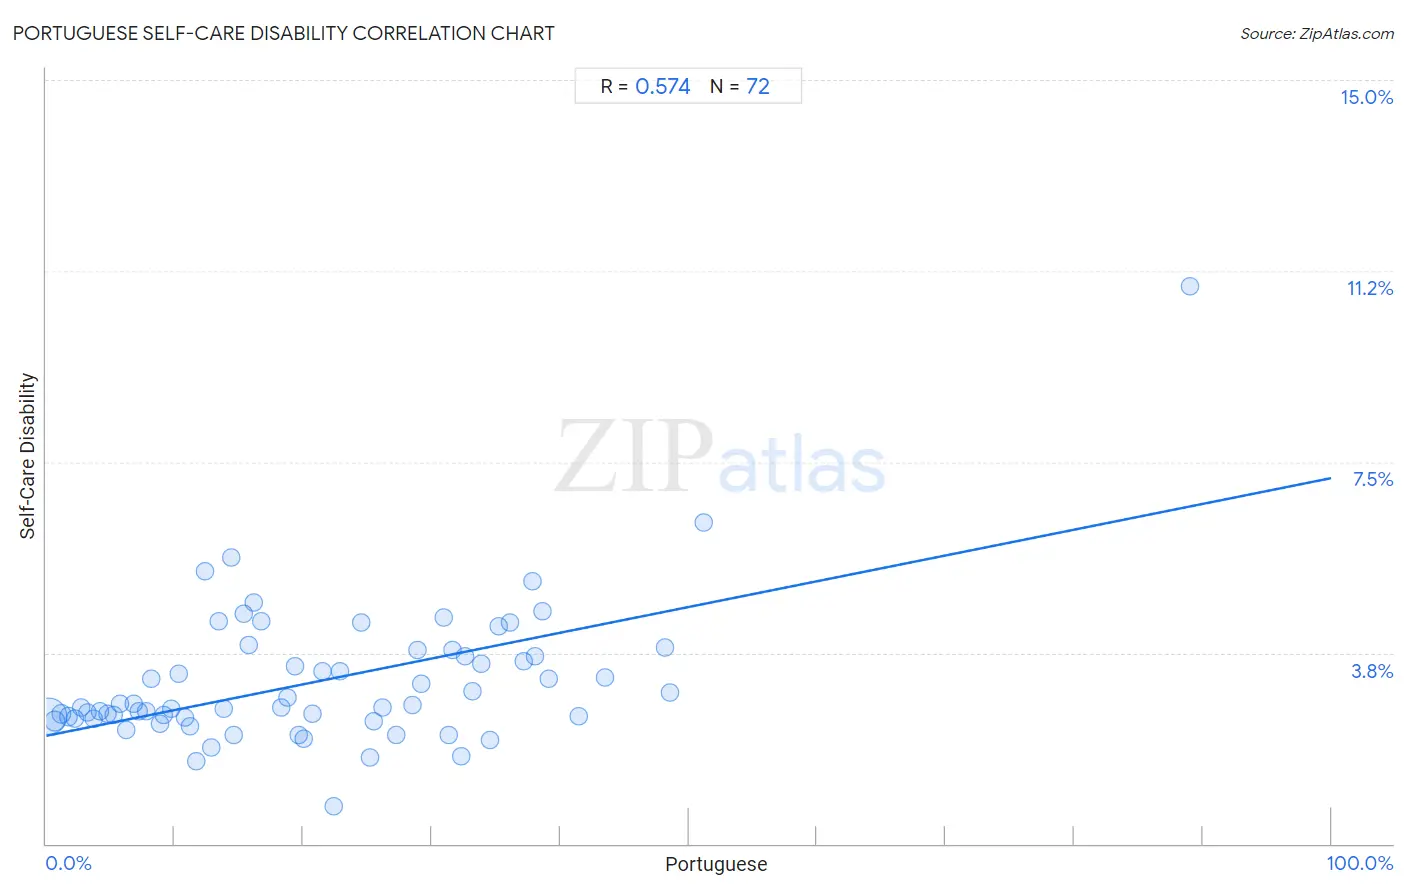
It is essential to understand that the correlation between the percentage of Portuguese and percentage of population with self-care disability does not imply a direct cause-and-effect relationship. It remains uncertain whether the presence of Portuguese influences an upward or downward trend in the level of percentage of population with self-care disability within an area, or if Portuguese simply ended up residing in those areas with higher or lower levels of percentage of population with self-care disability due to other factors.
Demographics Similar to Portuguese by Self-Care Disability
In terms of self-care disability, the demographic groups most similar to Portuguese are Mexican American Indian (2.6%, a difference of 0.080%), Immigrants from Liberia (2.6%, a difference of 0.080%), Immigrants from Bangladesh (2.6%, a difference of 0.15%), Immigrants from Haiti (2.6%, a difference of 0.23%), and Haitian (2.6%, a difference of 0.25%).
| Demographics | Rating | Rank | Self-Care Disability |
| Hawaiians | 0.8 /100 | #243 | Tragic 2.6% |
| Yuman | 0.8 /100 | #244 | Tragic 2.6% |
| Immigrants from Western Asia | 0.6 /100 | #245 | Tragic 2.6% |
| Cheyenne | 0.6 /100 | #246 | Tragic 2.6% |
| Immigrants from Albania | 0.6 /100 | #247 | Tragic 2.6% |
| Nicaraguans | 0.6 /100 | #248 | Tragic 2.6% |
| Mexican American Indians | 0.5 /100 | #249 | Tragic 2.6% |
| Portuguese | 0.4 /100 | #250 | Tragic 2.6% |
| Immigrants from Liberia | 0.4 /100 | #251 | Tragic 2.6% |
| Immigrants from Bangladesh | 0.4 /100 | #252 | Tragic 2.6% |
| Immigrants from Haiti | 0.3 /100 | #253 | Tragic 2.6% |
| Haitians | 0.3 /100 | #254 | Tragic 2.6% |
| Tsimshian | 0.3 /100 | #255 | Tragic 2.6% |
| Immigrants from Central America | 0.3 /100 | #256 | Tragic 2.6% |
| Potawatomi | 0.3 /100 | #257 | Tragic 2.6% |
Portuguese Self-Care Disability Correlation Summary
| Measurement | Portuguese Data | Self-Care Disability Data |
| Minimum | 0.18% | 0.74% |
| Maximum | 89.0% | 11.0% |
| Range | 88.9% | 10.2% |
| Mean | 21.3% | 3.2% |
| Median | 19.0% | 2.7% |
| Interquartile 25% (IQ1) | 9.0% | 2.5% |
| Interquartile 75% (IQ3) | 32.0% | 3.7% |
| Interquartile Range (IQR) | 23.0% | 1.3% |
| Standard Deviation (Sample) | 15.7% | 1.4% |
| Standard Deviation (Population) | 15.5% | 1.4% |
Correlation Details
| Portuguese Percentile | Sample Size | Self-Care Disability |
[ 0.0% - 0.5% ] 0.18% | 347,909,961 | 2.5% |
[ 0.5% - 1.0% ] 0.70% | 53,530,942 | 2.4% |
[ 1.0% - 1.5% ] 1.20% | 19,686,267 | 2.5% |
[ 1.5% - 2.0% ] 1.72% | 10,084,871 | 2.5% |
[ 2.0% - 2.5% ] 2.22% | 5,453,399 | 2.5% |
[ 2.5% - 3.0% ] 2.74% | 2,799,056 | 2.7% |
[ 3.0% - 3.5% ] 3.25% | 2,414,711 | 2.6% |
[ 3.5% - 4.0% ] 3.73% | 1,383,426 | 2.5% |
[ 4.0% - 4.5% ] 4.21% | 717,833 | 2.6% |
[ 4.5% - 5.0% ] 4.74% | 842,157 | 2.5% |
[ 5.0% - 5.5% ] 5.23% | 660,974 | 2.5% |
[ 5.5% - 6.0% ] 5.74% | 747,340 | 2.8% |
[ 6.0% - 6.5% ] 6.20% | 423,053 | 2.2% |
[ 6.5% - 7.0% ] 6.78% | 385,111 | 2.8% |
[ 7.0% - 7.5% ] 7.22% | 254,593 | 2.6% |
[ 7.5% - 8.0% ] 7.81% | 359,222 | 2.6% |
[ 8.0% - 8.5% ] 8.19% | 117,727 | 3.2% |
[ 8.5% - 9.0% ] 8.83% | 140,295 | 2.4% |
[ 9.0% - 9.5% ] 9.16% | 139,512 | 2.5% |
[ 9.5% - 10.0% ] 9.74% | 137,675 | 2.6% |
[ 10.0% - 10.5% ] 10.31% | 14,663 | 3.3% |
[ 10.5% - 11.0% ] 10.79% | 60,162 | 2.5% |
[ 11.0% - 11.5% ] 11.22% | 72,932 | 2.3% |
[ 11.5% - 12.0% ] 11.70% | 125,289 | 1.6% |
[ 12.0% - 12.5% ] 12.31% | 20,452 | 5.4% |
[ 12.5% - 13.0% ] 12.86% | 29,403 | 1.9% |
[ 13.0% - 13.5% ] 13.45% | 18,331 | 4.4% |
[ 13.5% - 14.0% ] 13.77% | 25,491 | 2.7% |
[ 14.0% - 14.5% ] 14.37% | 6,401 | 5.6% |
[ 14.5% - 15.0% ] 14.57% | 2,821 | 2.1% |
[ 15.0% - 15.5% ] 15.34% | 7,600 | 4.5% |
[ 15.5% - 16.0% ] 15.81% | 6,080 | 3.9% |
[ 16.0% - 16.5% ] 16.19% | 8,855 | 4.7% |
[ 16.5% - 17.0% ] 16.74% | 19,663 | 4.4% |
[ 18.0% - 18.5% ] 18.26% | 40,467 | 2.7% |
[ 18.5% - 19.0% ] 18.73% | 82,595 | 2.9% |
[ 19.0% - 19.5% ] 19.35% | 54,661 | 3.5% |
[ 19.5% - 20.0% ] 19.60% | 4,188 | 2.1% |
[ 20.0% - 20.5% ] 20.04% | 6,511 | 2.1% |
[ 20.5% - 21.0% ] 20.70% | 1,348 | 2.5% |
[ 21.0% - 21.5% ] 21.48% | 20,883 | 3.4% |
[ 22.0% - 22.5% ] 22.36% | 13,232 | 0.74% |
[ 22.5% - 23.0% ] 22.84% | 52,526 | 3.4% |
[ 24.5% - 25.0% ] 24.56% | 16,286 | 4.4% |
[ 25.0% - 25.5% ] 25.16% | 4,463 | 1.7% |
[ 25.5% - 26.0% ] 25.53% | 1,034 | 2.4% |
[ 26.0% - 26.5% ] 26.17% | 10,792 | 2.7% |
[ 27.0% - 27.5% ] 27.23% | 7,422 | 2.1% |
[ 28.0% - 28.5% ] 28.50% | 11,117 | 2.7% |
[ 28.5% - 29.0% ] 28.88% | 63,645 | 3.8% |
[ 29.0% - 29.5% ] 29.14% | 21,742 | 3.2% |
[ 30.5% - 31.0% ] 30.91% | 495 | 4.4% |
[ 31.0% - 31.5% ] 31.35% | 50,072 | 2.1% |
[ 31.5% - 32.0% ] 31.65% | 18,810 | 3.8% |
[ 32.0% - 32.5% ] 32.30% | 10,466 | 1.7% |
[ 32.5% - 33.0% ] 32.62% | 120,137 | 3.7% |
[ 33.0% - 33.5% ] 33.21% | 8,763 | 3.0% |
[ 33.5% - 34.0% ] 33.89% | 15,629 | 3.5% |
[ 34.5% - 35.0% ] 34.52% | 8,403 | 2.0% |
[ 35.0% - 35.5% ] 35.22% | 17,164 | 4.3% |
[ 36.0% - 36.5% ] 36.09% | 93,638 | 4.4% |
[ 37.0% - 37.5% ] 37.20% | 43,238 | 3.6% |
[ 37.5% - 38.0% ] 37.83% | 30,558 | 5.1% |
[ 38.0% - 38.5% ] 38.05% | 21,383 | 3.7% |
[ 38.5% - 39.0% ] 38.59% | 4,556 | 4.6% |
[ 39.0% - 39.5% ] 39.14% | 6,484 | 3.2% |
[ 41.0% - 41.5% ] 41.44% | 11,431 | 2.5% |
[ 43.0% - 43.5% ] 43.45% | 25,084 | 3.3% |
[ 48.0% - 48.5% ] 48.18% | 4,660 | 3.9% |
[ 48.5% - 49.0% ] 48.56% | 5,591 | 3.0% |
[ 51.0% - 51.5% ] 51.18% | 127 | 6.3% |
[ 89.0% - 89.5% ] 89.04% | 73 | 11.0% |