Croatian Self-Care Disability
COMPARE
Croatian
Select to Compare
Self-Care Disability
Croatian Self-Care Disability
2.4%
SELF-CARE DISABILITY
95.0/ 100
METRIC RATING
102nd/ 347
METRIC RANK
Croatian Self-Care Disability Correlation Chart
The statistical analysis conducted on geographies consisting of 375,273,101 people shows a strong positive correlation between the proportion of Croatians and percentage of population with self-care disability in the United States with a correlation coefficient (R) of 0.781 and weighted average of 2.4%. On average, for every 1% (one percent) increase in Croatians within a typical geography, there is an increase of 0.46% in percentage of population with self-care disability.
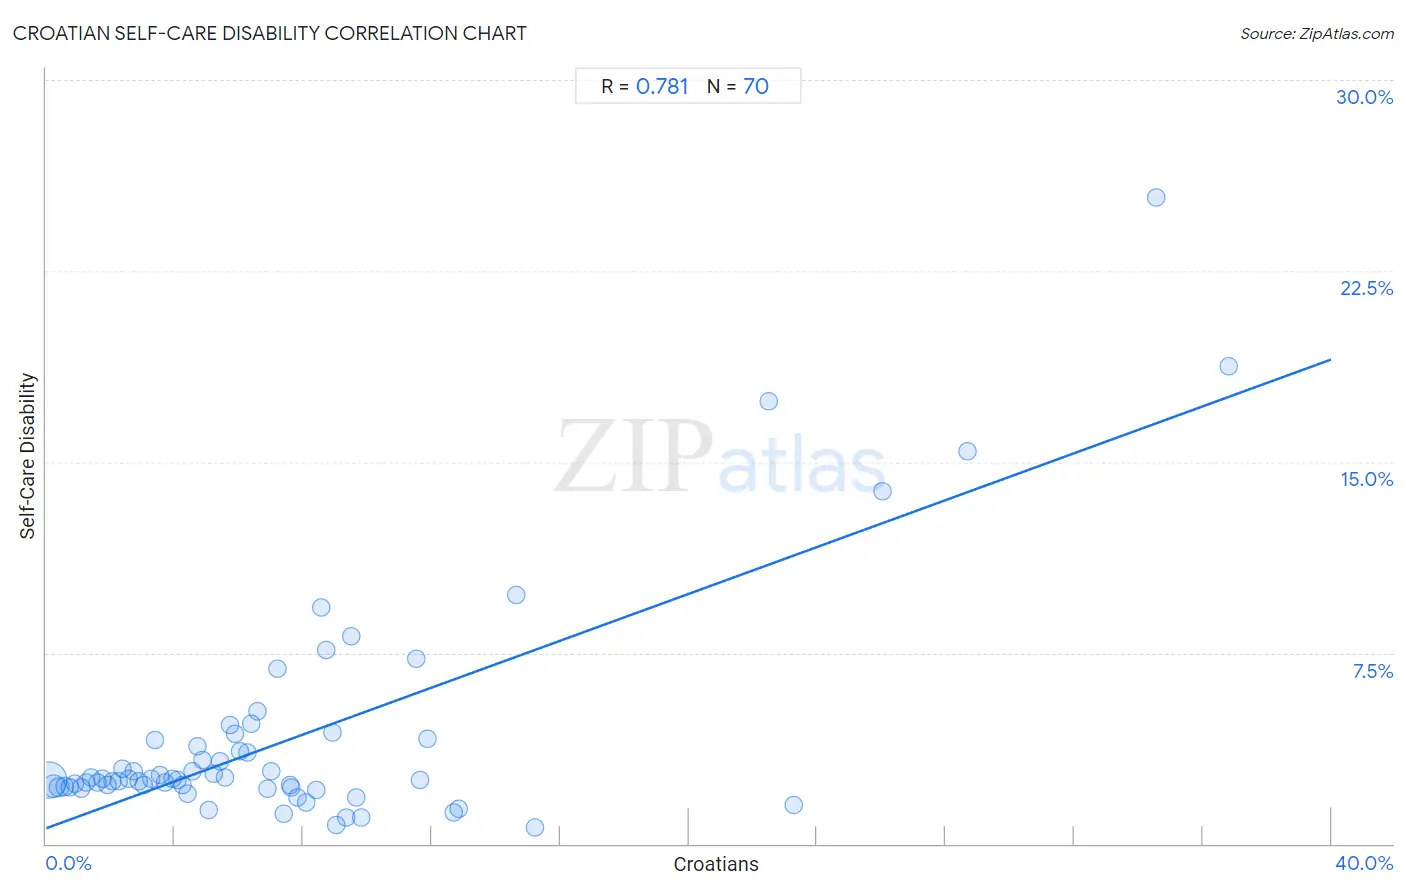
It is essential to understand that the correlation between the percentage of Croatians and percentage of population with self-care disability does not imply a direct cause-and-effect relationship. It remains uncertain whether the presence of Croatians influences an upward or downward trend in the level of percentage of population with self-care disability within an area, or if Croatians simply ended up residing in those areas with higher or lower levels of percentage of population with self-care disability due to other factors.
Demographics Similar to Croatians by Self-Care Disability
In terms of self-care disability, the demographic groups most similar to Croatians are Alsatian (2.4%, a difference of 0.030%), Bhutanese (2.4%, a difference of 0.13%), Carpatho Rusyn (2.4%, a difference of 0.17%), Immigrants from Scotland (2.4%, a difference of 0.18%), and Immigrants from Indonesia (2.4%, a difference of 0.18%).
| Demographics | Rating | Rank | Self-Care Disability |
| Immigrants from Asia | 96.9 /100 | #95 | Exceptional 2.4% |
| Immigrants from Chile | 96.7 /100 | #96 | Exceptional 2.4% |
| Swiss | 96.6 /100 | #97 | Exceptional 2.4% |
| Immigrants from Poland | 96.4 /100 | #98 | Exceptional 2.4% |
| Immigrants from Israel | 96.1 /100 | #99 | Exceptional 2.4% |
| Europeans | 95.8 /100 | #100 | Exceptional 2.4% |
| Immigrants from Scotland | 95.7 /100 | #101 | Exceptional 2.4% |
| Croatians | 95.0 /100 | #102 | Exceptional 2.4% |
| Alsatians | 94.9 /100 | #103 | Exceptional 2.4% |
| Bhutanese | 94.5 /100 | #104 | Exceptional 2.4% |
| Carpatho Rusyns | 94.4 /100 | #105 | Exceptional 2.4% |
| Immigrants from Indonesia | 94.3 /100 | #106 | Exceptional 2.4% |
| British | 94.3 /100 | #107 | Exceptional 2.4% |
| Greeks | 94.1 /100 | #108 | Exceptional 2.4% |
| Slovenes | 94.1 /100 | #109 | Exceptional 2.4% |
Croatian Self-Care Disability Correlation Summary
| Measurement | Croatian Data | Self-Care Disability Data |
| Minimum | 0.073% | 0.62% |
| Maximum | 36.8% | 25.4% |
| Range | 36.7% | 24.8% |
| Mean | 7.7% | 4.1% |
| Median | 5.8% | 2.5% |
| Interquartile 25% (IQ1) | 2.9% | 2.2% |
| Interquartile 75% (IQ3) | 9.0% | 4.1% |
| Interquartile Range (IQR) | 6.1% | 1.9% |
| Standard Deviation (Sample) | 7.6% | 4.5% |
| Standard Deviation (Population) | 7.5% | 4.4% |
Correlation Details
| Croatian Percentile | Sample Size | Self-Care Disability |
[ 0.0% - 0.5% ] 0.073% | 256,124,989 | 2.5% |
[ 0.0% - 0.5% ] 0.23% | 70,185,014 | 2.3% |
[ 0.0% - 0.5% ] 0.40% | 22,849,404 | 2.2% |
[ 0.5% - 1.0% ] 0.57% | 9,796,128 | 2.2% |
[ 0.5% - 1.0% ] 0.74% | 5,796,925 | 2.2% |
[ 0.5% - 1.0% ] 0.91% | 3,168,753 | 2.4% |
[ 1.0% - 1.5% ] 1.08% | 1,820,092 | 2.2% |
[ 1.0% - 1.5% ] 1.24% | 1,028,073 | 2.4% |
[ 1.0% - 1.5% ] 1.40% | 653,052 | 2.6% |
[ 1.5% - 2.0% ] 1.58% | 539,783 | 2.4% |
[ 1.5% - 2.0% ] 1.75% | 625,760 | 2.6% |
[ 1.5% - 2.0% ] 1.91% | 510,256 | 2.3% |
[ 2.0% - 2.5% ] 2.07% | 363,262 | 2.5% |
[ 2.0% - 2.5% ] 2.24% | 370,832 | 2.4% |
[ 2.0% - 2.5% ] 2.39% | 331,302 | 2.9% |
[ 2.5% - 3.0% ] 2.58% | 166,640 | 2.6% |
[ 2.5% - 3.0% ] 2.71% | 113,580 | 2.8% |
[ 2.5% - 3.0% ] 2.89% | 168,131 | 2.5% |
[ 3.0% - 3.5% ] 3.03% | 125,407 | 2.3% |
[ 3.0% - 3.5% ] 3.26% | 30,991 | 2.6% |
[ 3.0% - 3.5% ] 3.39% | 65,532 | 4.1% |
[ 3.5% - 4.0% ] 3.56% | 41,701 | 2.7% |
[ 3.5% - 4.0% ] 3.71% | 83,505 | 2.4% |
[ 3.5% - 4.0% ] 3.92% | 19,060 | 2.5% |
[ 4.0% - 4.5% ] 4.08% | 31,818 | 2.5% |
[ 4.0% - 4.5% ] 4.23% | 115,271 | 2.3% |
[ 4.0% - 4.5% ] 4.40% | 6,703 | 2.0% |
[ 4.5% - 5.0% ] 4.54% | 16,263 | 2.9% |
[ 4.5% - 5.0% ] 4.71% | 10,344 | 3.8% |
[ 4.5% - 5.0% ] 4.88% | 8,704 | 3.3% |
[ 5.0% - 5.5% ] 5.07% | 4,797 | 1.3% |
[ 5.0% - 5.5% ] 5.19% | 14,553 | 2.7% |
[ 5.0% - 5.5% ] 5.40% | 1,407 | 3.3% |
[ 5.5% - 6.0% ] 5.58% | 29,415 | 2.6% |
[ 5.5% - 6.0% ] 5.72% | 3,989 | 4.7% |
[ 5.5% - 6.0% ] 5.86% | 7,775 | 4.3% |
[ 6.0% - 6.5% ] 6.03% | 5,376 | 3.6% |
[ 6.0% - 6.5% ] 6.26% | 3,307 | 3.6% |
[ 6.0% - 6.5% ] 6.39% | 2,614 | 4.7% |
[ 6.5% - 7.0% ] 6.57% | 731 | 5.2% |
[ 6.5% - 7.0% ] 6.89% | 5,038 | 2.2% |
[ 7.0% - 7.5% ] 7.00% | 8,995 | 2.8% |
[ 7.0% - 7.5% ] 7.21% | 652 | 6.9% |
[ 7.0% - 7.5% ] 7.39% | 176 | 1.2% |
[ 7.5% - 8.0% ] 7.57% | 1,466 | 2.3% |
[ 7.5% - 8.0% ] 7.64% | 314 | 2.2% |
[ 7.5% - 8.0% ] 7.83% | 1,251 | 1.8% |
[ 8.0% - 8.5% ] 8.10% | 1,444 | 1.6% |
[ 8.0% - 8.5% ] 8.42% | 1,164 | 2.1% |
[ 8.5% - 9.0% ] 8.56% | 397 | 9.3% |
[ 8.5% - 9.0% ] 8.72% | 447 | 7.6% |
[ 8.5% - 9.0% ] 8.92% | 415 | 4.4% |
[ 9.0% - 9.5% ] 9.03% | 299 | 0.73% |
[ 9.0% - 9.5% ] 9.35% | 492 | 1.0% |
[ 9.5% - 10.0% ] 9.51% | 1,378 | 8.2% |
[ 9.5% - 10.0% ] 9.64% | 394 | 1.8% |
[ 9.5% - 10.0% ] 9.82% | 1,181 | 1.1% |
[ 11.5% - 12.0% ] 11.50% | 339 | 7.3% |
[ 11.5% - 12.0% ] 11.62% | 912 | 2.5% |
[ 11.5% - 12.0% ] 11.87% | 396 | 4.1% |
[ 12.5% - 13.0% ] 12.67% | 1,318 | 1.2% |
[ 12.5% - 13.0% ] 12.85% | 358 | 1.4% |
[ 14.5% - 15.0% ] 14.62% | 253 | 9.8% |
[ 15.0% - 15.5% ] 15.23% | 348 | 0.62% |
[ 22.0% - 22.5% ] 22.49% | 369 | 17.4% |
[ 23.0% - 23.5% ] 23.29% | 73 | 1.5% |
[ 26.0% - 26.5% ] 26.04% | 672 | 13.8% |
[ 28.5% - 29.0% ] 28.69% | 610 | 15.4% |
[ 34.5% - 35.0% ] 34.57% | 567 | 25.4% |
[ 36.5% - 37.0% ] 36.81% | 144 | 18.8% |