Scotch-Irish Unemployment

COMPARE

Scotch-Irish
Race
Ancestry
AfghanAfricanAlaska NativeAlaskan AthabascanAlbanianAleutAlsatianAmericanApacheArabArapahoArgentineanArmenianAssyrian/Chaldean/SyriacAustralianAustrianBahamianBangladeshiBarbadianBasqueBelgianBelizeanBermudanBhutaneseBlackfeetBolivianBrazilianBritishBritish West IndianBulgarianBurmeseCajunCambodianCanadianCape VerdeanCarpatho RusynCelticCentral AmericanCentral American IndianCherokeeCheyenneChickasawChileanChineseChippewaChoctawColombianColvilleComancheCosta RicanCreeCreekCroatianCrowCubanCypriotCzechCzechoslovakianDanishDelawareDominicanDutchDutch West IndianEastern EuropeanEcuadorianEgyptianEnglishEstonianEthiopianEuropeanFijianFilipinoFinnishFrenchFrench American IndianFrench CanadianGermanGerman RussianGhanaianGreekGuamanian/ChamorroGuatemalanGuyaneseHaitianHmongHonduranHopiHoumaHungarianIcelanderIndian (Asian)IndonesianInupiatIranianIraqiIrishIroquoisIsraeliItalianJamaicanJapaneseJordanianKenyanKiowaKoreanLaotianLatvianLebaneseLiberianLithuanianLumbeeLuxembourgerMacedonianMalaysianMalteseMarshalleseMenomineeMexicanMexican American IndianMongolianMoroccanNative HawaiianNavajoNepaleseNew ZealanderNicaraguanNigerianNorthern EuropeanNorwegianOkinawanOsageOttawaPaiutePakistaniPalestinianPanamanianParaguayanPennsylvania GermanPeruvianPimaPolishPortuguesePotawatomiPuebloPuerto RicanPuget Sound SalishRomanianRussianSalvadoranSamoanScandinavianScotch-IrishScottishSeminoleSenegaleseSerbianShoshoneSierra LeoneanSiouxSlavicSlovakSloveneSomaliSouth AfricanSouth AmericanSouth American IndianSoviet UnionSpaniardSpanishSpanish AmericanSpanish American IndianSri LankanSubsaharan AfricanSudaneseSwedishSwissSyrianTaiwaneseThaiTlingit-HaidaTohono O'OdhamTonganTrinidadian and TobagonianTsimshianTurkishU.S. Virgin IslanderUgandanUkrainianUruguayanUteVenezuelanVietnameseWelshWest IndianYakamaYaquiYugoslavianYumanYup'ikZimbabwean
Immigration
NonimmigrantsImmigrantsAfghanistanAfricaAlbaniaArgentinaArmeniaAsiaAustraliaAustriaBahamasBangladeshBarbadosBelarusBelgiumBelizeBoliviaBosnia and HerzegovinaBrazilBulgariaBurma/MyanmarCabo VerdeCambodiaCameroonCanadaCaribbeanCentral AmericaChileChinaColombiaCongoCosta RicaCroatiaCubaCzechoslovakiaDenmarkDominicaDominican RepublicEastern AfricaEastern AsiaEastern EuropeEcuadorEgyptEl SalvadorEnglandEritreaEthiopiaEuropeFijiFranceGermanyGhanaGreeceGrenadaGuatemalaGuyanaHaitiHondurasHong KongHungaryIndiaIndonesiaIranIraqIrelandIsraelItalyJamaicaJapanJordanKazakhstanKenyaKoreaKuwaitLaosLatin AmericaLatviaLebanonLiberiaLithuaniaMalaysiaMexicoMicronesiaMiddle AfricaMoldovaMoroccoNepalNetherlandsNicaraguaNigeriaNorth AmericaNorth MacedoniaNorthern AfricaNorthern EuropeNorwayOceaniaPakistanPanamaPeruPhilippinesPolandPortugalRomaniaRussiaSaudi ArabiaScotlandSenegalSerbiaSierra LeoneSingaporeSomaliaSouth AfricaSouth AmericaSouth Central AsiaSouth Eastern AsiaSouthern EuropeSpainSri LankaSt. Vincent and the GrenadinesSudanSwedenSwitzerlandSyriaTaiwanThailandTrinidad and TobagoTurkeyUgandaUkraineUruguayUzbekistanVenezuelaVietnamWest IndiesWestern AfricaWestern AsiaWestern EuropeYemenZaireZimbabweAzores
Select to Compare
Race
Ancestry
AfghanAfricanAlaska NativeAlaskan AthabascanAlbanianAleutAlsatianAmericanApacheArabArapahoArgentineanArmenianAssyrian/Chaldean/SyriacAustralianAustrianBahamianBangladeshiBarbadianBasqueBelgianBelizeanBermudanBhutaneseBlackfeetBolivianBrazilianBritishBritish West IndianBulgarianBurmeseCajunCambodianCanadianCape VerdeanCarpatho RusynCelticCentral AmericanCentral American IndianCherokeeCheyenneChickasawChileanChineseChippewaChoctawColombianColvilleComancheCosta RicanCreeCreekCroatianCrowCubanCypriotCzechCzechoslovakianDanishDelawareDominicanDutchDutch West IndianEastern EuropeanEcuadorianEgyptianEnglishEstonianEthiopianEuropeanFijianFilipinoFinnishFrenchFrench American IndianFrench CanadianGermanGerman RussianGhanaianGreekGuamanian/ChamorroGuatemalanGuyaneseHaitianHmongHonduranHopiHoumaHungarianIcelanderIndian (Asian)IndonesianInupiatIranianIraqiIrishIroquoisIsraeliItalianJamaicanJapaneseJordanianKenyanKiowaKoreanLaotianLatvianLebaneseLiberianLithuanianLumbeeLuxembourgerMacedonianMalaysianMalteseMarshalleseMenomineeMexicanMexican American IndianMongolianMoroccanNative HawaiianNavajoNepaleseNew ZealanderNicaraguanNigerianNorthern EuropeanNorwegianOkinawanOsageOttawaPaiutePakistaniPalestinianPanamanianParaguayanPennsylvania GermanPeruvianPimaPolishPortuguesePotawatomiPuebloPuerto RicanPuget Sound SalishRomanianRussianSalvadoranSamoanScandinavianScottishSeminoleSenegaleseSerbianShoshoneSierra LeoneanSiouxSlavicSlovakSloveneSomaliSouth AfricanSouth AmericanSouth American IndianSoviet UnionSpaniardSpanishSpanish AmericanSpanish American IndianSri LankanSubsaharan AfricanSudaneseSwedishSwissSyrianTaiwaneseThaiTlingit-HaidaTohono O'OdhamTonganTrinidadian and TobagonianTsimshianTurkishU.S. Virgin IslanderUgandanUkrainianUruguayanUteVenezuelanVietnameseWelshWest IndianYakamaYaquiYugoslavianYumanYup'ikZimbabwean
Immigration
NonimmigrantsImmigrantsAfghanistanAfricaAlbaniaArgentinaArmeniaAsiaAustraliaAustriaBahamasBangladeshBarbadosBelarusBelgiumBelizeBoliviaBosnia and HerzegovinaBrazilBulgariaBurma/MyanmarCabo VerdeCambodiaCameroonCanadaCaribbeanCentral AmericaChileChinaColombiaCongoCosta RicaCroatiaCubaCzechoslovakiaDenmarkDominicaDominican RepublicEastern AfricaEastern AsiaEastern EuropeEcuadorEgyptEl SalvadorEnglandEritreaEthiopiaEuropeFijiFranceGermanyGhanaGreeceGrenadaGuatemalaGuyanaHaitiHondurasHong KongHungaryIndiaIndonesiaIranIraqIrelandIsraelItalyJamaicaJapanJordanKazakhstanKenyaKoreaKuwaitLaosLatin AmericaLatviaLebanonLiberiaLithuaniaMalaysiaMexicoMicronesiaMiddle AfricaMoldovaMoroccoNepalNetherlandsNicaraguaNigeriaNorth AmericaNorth MacedoniaNorthern AfricaNorthern EuropeNorwayOceaniaPakistanPanamaPeruPhilippinesPolandPortugalRomaniaRussiaSaudi ArabiaScotlandSenegalSerbiaSierra LeoneSingaporeSomaliaSouth AfricaSouth AmericaSouth Central AsiaSouth Eastern AsiaSouthern EuropeSpainSri LankaSt. Vincent and the GrenadinesSudanSwedenSwitzerlandSyriaTaiwanThailandTrinidad and TobagoTurkeyUgandaUkraineUruguayUzbekistanVenezuelaVietnamWest IndiesWestern AfricaWestern AsiaWestern EuropeYemenZaireZimbabweAzores
Unemployment
Income
Poverty
Unemployment
Labor Participation
Family Structure
Vehicle Availability
Education Level
Disability

Scotch-Irish Unemployment
Exceptional

4.8%
UNEMPLOYMENT
99.8/ 100
METRIC RATING
35th/ 347
METRIC RANK

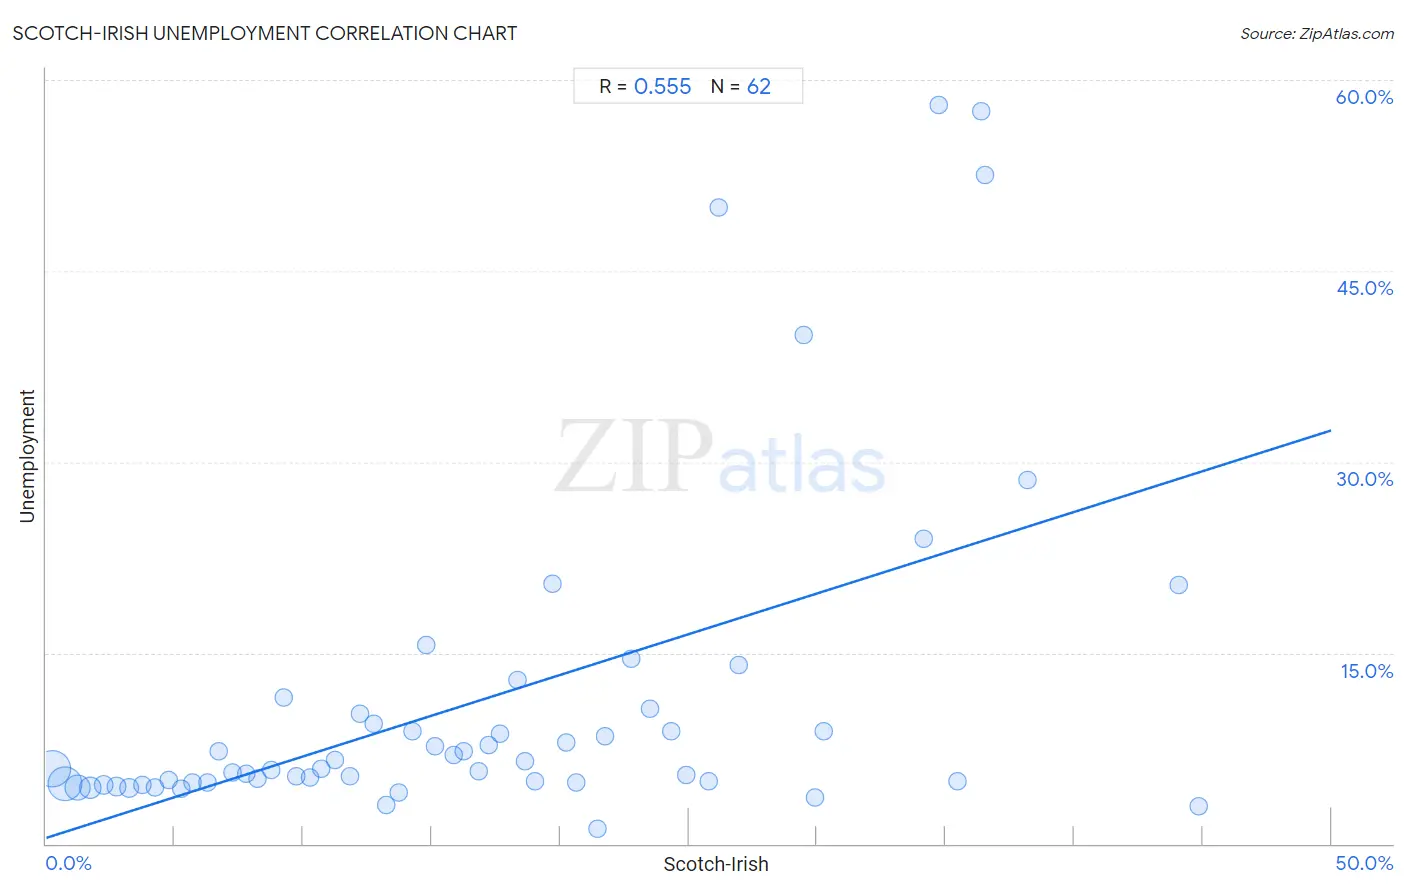
Scotch-Irish Unemployment Correlation Chart

The statistical analysis conducted on geographies consisting of 545,559,279 people shows a substantial positive correlation between the proportion of Scotch-Irish and unemployment in the United States with a correlation coefficient (R) of 0.555 and weighted average of 4.8%. On average, for every 1% (one percent) increase in Scotch-Irish within a typical geography, there is an increase of 0.64% in unemployment.
Scotch-Irish Unemployment
It is essential to understand that the correlation between the percentage of Scotch-Irish and unemployment does not imply a direct cause-and-effect relationship. It remains uncertain whether the presence of Scotch-Irish influences an upward or downward trend in the level of unemployment within an area, or if Scotch-Irish simply ended up residing in those areas with higher or lower levels of unemployment due to other factors.

Demographics Similar to Scotch-Irish by Unemployment

In terms of unemployment, the demographic groups most similar to Scotch-Irish are Immigrants from Bolivia (4.8%, a difference of 0.070%), Sudanese (4.8%, a difference of 0.11%), Zimbabwean (4.8%, a difference of 0.12%), Croatian (4.8%, a difference of 0.22%), and Tongan (4.8%, a difference of 0.22%).
DemographicsRating | RankUnemployment
Cubans
99.8
/100
|
#28
Exceptional
4.7%
Poles
99.8
/100
|
#29
Exceptional
4.7%
Irish
99.8
/100
|
#30
Exceptional
4.8%
Croatians
99.8
/100
|
#31
Exceptional
4.8%
Zimbabweans
99.8
/100
|
#32
Exceptional
4.8%
Sudanese
99.8
/100
|
#33
Exceptional
4.8%
Immigrants from Bolivia
99.8
/100
|
#34
Exceptional
4.8%
Scotch-Irish
99.8
/100
|
#35
Exceptional
4.8%
Tongans
99.7
/100
|
#36
Exceptional
4.8%
Czechoslovakians
99.7
/100
|
#37
Exceptional
4.8%
Bolivians
99.7
/100
|
#38
Exceptional
4.8%
Lithuanians
99.7
/100
|
#39
Exceptional
4.8%
Northern Europeans
99.7
/100
|
#40
Exceptional
4.8%
Immigrants from Bosnia and Herzegovina
99.7
/100
|
#41
Exceptional
4.8%
Filipinos
99.5
/100
|
#42
Exceptional
4.8%

Scotch-Irish Unemployment Correlation Summary

MeasurementScotch-Irish DataUnemployment Data
Minimum0.25%1.2%
Maximum44.8%58.0%
Range44.6%56.8%
Mean17.0%11.3%
Median15.5%5.9%
Interquartile 25% (IQ1)7.8%4.8%
Interquartile 75% (IQ3)24.3%10.2%
Interquartile Range (IQR)16.5%5.4%
Standard Deviation (Sample)11.4%13.2%
Standard Deviation (Population)11.3%13.1%

Correlation Details

Scotch-Irish PercentileSample SizeUnemployment
[
0.0%
-
0.5%
]
0.25%
210,141,3485.9%
[
0.5%
-
1.0%
]
0.72%
182,542,0404.8%
[
1.0%
-
1.5%
]
1.21%
82,231,9734.5%
[
1.5%
-
2.0%
]
1.71%
36,192,2414.4%
[
2.0%
-
2.5%
]
2.21%
15,699,0644.6%
[
2.5%
-
3.0%
]
2.73%
7,712,0574.5%
[
3.0%
-
3.5%
]
3.23%
5,001,6124.4%
[
3.5%
-
4.0%
]
3.75%
2,370,9034.7%
[
4.0%
-
4.5%
]
4.25%
1,221,0864.5%
[
4.5%
-
5.0%
]
4.75%
698,2585.0%
[
5.0%
-
5.5%
]
5.23%
592,8844.3%
[
5.5%
-
6.0%
]
5.71%
293,4104.8%
[
6.0%
-
6.5%
]
6.29%
181,1564.8%
[
6.5%
-
7.0%
]
6.72%
118,9617.3%
[
7.0%
-
7.5%
]
7.23%
99,6145.6%
[
7.5%
-
8.0%
]
7.79%
95,0475.5%
[
8.0%
-
8.5%
]
8.22%
61,5575.1%
[
8.5%
-
9.0%
]
8.75%
50,8885.8%
[
9.0%
-
9.5%
]
9.25%
33,23511.5%
[
9.5%
-
10.0%
]
9.75%
31,9035.3%
[
10.0%
-
10.5%
]
10.28%
31,2505.2%
[
10.5%
-
11.0%
]
10.71%
21,8145.9%
[
11.0%
-
11.5%
]
11.23%
15,4966.6%
[
11.5%
-
12.0%
]
11.83%
11,0855.3%
[
12.0%
-
12.5%
]
12.23%
7,21410.2%
[
12.5%
-
13.0%
]
12.74%
3,5099.5%
[
13.0%
-
13.5%
]
13.22%
16,9103.1%
[
13.5%
-
14.0%
]
13.69%
13,0714.0%
[
14.0%
-
14.5%
]
14.26%
14,7218.9%
[
14.5%
-
15.0%
]
14.80%
2,00015.6%
[
15.0%
-
15.5%
]
15.15%
4,1327.6%
[
15.5%
-
16.0%
]
15.87%
3,5797.0%
[
16.0%
-
16.5%
]
16.24%
8,3917.3%
[
16.5%
-
17.0%
]
16.81%
4,7765.7%
[
17.0%
-
17.5%
]
17.21%
4,8117.7%
[
17.5%
-
18.0%
]
17.66%
7,9808.7%
[
18.0%
-
18.5%
]
18.32%
1,86712.9%
[
18.5%
-
19.0%
]
18.64%
1,7496.5%
[
19.0%
-
19.5%
]
19.03%
5574.9%
[
19.5%
-
20.0%
]
19.72%
1,13620.4%
[
20.0%
-
20.5%
]
20.24%
4998.0%
[
20.5%
-
21.0%
]
20.63%
9894.8%
[
21.0%
-
21.5%
]
21.47%
3681.2%
[
21.5%
-
22.0%
]
21.72%
1,3958.4%
[
22.5%
-
23.0%
]
22.75%
1,27514.5%
[
23.0%
-
23.5%
]
23.48%
90310.6%
[
24.0%
-
24.5%
]
24.30%
2518.8%
[
24.5%
-
25.0%
]
24.88%
1,6885.4%
[
25.5%
-
26.0%
]
25.77%
1634.9%
[
26.0%
-
26.5%
]
26.16%
23750.0%
[
26.5%
-
27.0%
]
26.92%
36414.0%
[
29.0%
-
29.5%
]
29.49%
21740.0%
[
29.5%
-
30.0%
]
29.91%
6623.6%
[
30.0%
-
30.5%
]
30.23%
1,8398.8%
[
34.0%
-
34.5%
]
34.13%
63024.0%
[
34.5%
-
35.0%
]
34.74%
30858.0%
[
35.0%
-
35.5%
]
35.46%
1414.9%
[
36.0%
-
36.5%
]
36.40%
72857.5%
[
36.5%
-
37.0%
]
36.53%
60552.5%
[
38.0%
-
38.5%
]
38.18%
5528.6%
[
44.0%
-
44.5%
]
44.08%
33820.3%
[
44.5%
-
45.0%
]
44.84%
3392.9%