German Russian Self-Care Disability

COMPARE

German Russian
Race
Ancestry
AfghanAfricanAlaska NativeAlaskan AthabascanAlbanianAleutAlsatianAmericanApacheArabArapahoArgentineanArmenianAssyrian/Chaldean/SyriacAustralianAustrianBahamianBangladeshiBarbadianBasqueBelgianBelizeanBermudanBhutaneseBlackfeetBolivianBrazilianBritishBritish West IndianBulgarianBurmeseCajunCambodianCanadianCape VerdeanCarpatho RusynCelticCentral AmericanCentral American IndianCherokeeCheyenneChickasawChileanChineseChippewaChoctawColombianColvilleComancheCosta RicanCreeCreekCroatianCrowCubanCypriotCzechCzechoslovakianDanishDelawareDominicanDutchDutch West IndianEastern EuropeanEcuadorianEgyptianEnglishEstonianEthiopianEuropeanFijianFilipinoFinnishFrenchFrench American IndianFrench CanadianGermanGerman RussianGhanaianGreekGuamanian/ChamorroGuatemalanGuyaneseHaitianHmongHonduranHopiHoumaHungarianIcelanderIndian (Asian)IndonesianInupiatIranianIraqiIrishIroquoisIsraeliItalianJamaicanJapaneseJordanianKenyanKiowaKoreanLaotianLatvianLebaneseLiberianLithuanianLumbeeLuxembourgerMacedonianMalaysianMalteseMarshalleseMenomineeMexicanMexican American IndianMongolianMoroccanNative HawaiianNavajoNepaleseNew ZealanderNicaraguanNigerianNorthern EuropeanNorwegianOkinawanOsageOttawaPaiutePakistaniPalestinianPanamanianParaguayanPennsylvania GermanPeruvianPimaPolishPortuguesePotawatomiPuebloPuerto RicanPuget Sound SalishRomanianRussianSalvadoranSamoanScandinavianScotch-IrishScottishSeminoleSenegaleseSerbianShoshoneSierra LeoneanSiouxSlavicSlovakSloveneSomaliSouth AfricanSouth AmericanSouth American IndianSoviet UnionSpaniardSpanishSpanish AmericanSpanish American IndianSri LankanSubsaharan AfricanSudaneseSwedishSwissSyrianTaiwaneseThaiTlingit-HaidaTohono O'OdhamTonganTrinidadian and TobagonianTsimshianTurkishU.S. Virgin IslanderUgandanUkrainianUruguayanUteVenezuelanVietnameseWelshWest IndianYakamaYaquiYugoslavianYumanYup'ikZimbabwean
Immigration
NonimmigrantsImmigrantsAfghanistanAfricaAlbaniaArgentinaArmeniaAsiaAustraliaAustriaBahamasBangladeshBarbadosBelarusBelgiumBelizeBoliviaBosnia and HerzegovinaBrazilBulgariaBurma/MyanmarCabo VerdeCambodiaCameroonCanadaCaribbeanCentral AmericaChileChinaColombiaCongoCosta RicaCroatiaCubaCzechoslovakiaDenmarkDominicaDominican RepublicEastern AfricaEastern AsiaEastern EuropeEcuadorEgyptEl SalvadorEnglandEritreaEthiopiaEuropeFijiFranceGermanyGhanaGreeceGrenadaGuatemalaGuyanaHaitiHondurasHong KongHungaryIndiaIndonesiaIranIraqIrelandIsraelItalyJamaicaJapanJordanKazakhstanKenyaKoreaKuwaitLaosLatin AmericaLatviaLebanonLiberiaLithuaniaMalaysiaMexicoMicronesiaMiddle AfricaMoldovaMoroccoNepalNetherlandsNicaraguaNigeriaNorth AmericaNorth MacedoniaNorthern AfricaNorthern EuropeNorwayOceaniaPakistanPanamaPeruPhilippinesPolandPortugalRomaniaRussiaSaudi ArabiaScotlandSenegalSerbiaSierra LeoneSingaporeSomaliaSouth AfricaSouth AmericaSouth Central AsiaSouth Eastern AsiaSouthern EuropeSpainSri LankaSt. Vincent and the GrenadinesSudanSwedenSwitzerlandSyriaTaiwanThailandTrinidad and TobagoTurkeyUgandaUkraineUruguayUzbekistanVenezuelaVietnamWest IndiesWestern AfricaWestern AsiaWestern EuropeYemenZaireZimbabweAzores
Select to Compare
Race
Ancestry
AfghanAfricanAlaska NativeAlaskan AthabascanAlbanianAleutAlsatianAmericanApacheArabArapahoArgentineanArmenianAssyrian/Chaldean/SyriacAustralianAustrianBahamianBangladeshiBarbadianBasqueBelgianBelizeanBermudanBhutaneseBlackfeetBolivianBrazilianBritishBritish West IndianBulgarianBurmeseCajunCambodianCanadianCape VerdeanCarpatho RusynCelticCentral AmericanCentral American IndianCherokeeCheyenneChickasawChileanChineseChippewaChoctawColombianColvilleComancheCosta RicanCreeCreekCroatianCrowCubanCypriotCzechCzechoslovakianDanishDelawareDominicanDutchDutch West IndianEastern EuropeanEcuadorianEgyptianEnglishEstonianEthiopianEuropeanFijianFilipinoFinnishFrenchFrench American IndianFrench CanadianGermanGhanaianGreekGuamanian/ChamorroGuatemalanGuyaneseHaitianHmongHonduranHopiHoumaHungarianIcelanderIndian (Asian)IndonesianInupiatIranianIraqiIrishIroquoisIsraeliItalianJamaicanJapaneseJordanianKenyanKiowaKoreanLaotianLatvianLebaneseLiberianLithuanianLumbeeLuxembourgerMacedonianMalaysianMalteseMarshalleseMenomineeMexicanMexican American IndianMongolianMoroccanNative HawaiianNavajoNepaleseNew ZealanderNicaraguanNigerianNorthern EuropeanNorwegianOkinawanOsageOttawaPaiutePakistaniPalestinianPanamanianParaguayanPennsylvania GermanPeruvianPimaPolishPortuguesePotawatomiPuebloPuerto RicanPuget Sound SalishRomanianRussianSalvadoranSamoanScandinavianScotch-IrishScottishSeminoleSenegaleseSerbianShoshoneSierra LeoneanSiouxSlavicSlovakSloveneSomaliSouth AfricanSouth AmericanSouth American IndianSoviet UnionSpaniardSpanishSpanish AmericanSpanish American IndianSri LankanSubsaharan AfricanSudaneseSwedishSwissSyrianTaiwaneseThaiTlingit-HaidaTohono O'OdhamTonganTrinidadian and TobagonianTsimshianTurkishU.S. Virgin IslanderUgandanUkrainianUruguayanUteVenezuelanVietnameseWelshWest IndianYakamaYaquiYugoslavianYumanYup'ikZimbabwean
Immigration
NonimmigrantsImmigrantsAfghanistanAfricaAlbaniaArgentinaArmeniaAsiaAustraliaAustriaBahamasBangladeshBarbadosBelarusBelgiumBelizeBoliviaBosnia and HerzegovinaBrazilBulgariaBurma/MyanmarCabo VerdeCambodiaCameroonCanadaCaribbeanCentral AmericaChileChinaColombiaCongoCosta RicaCroatiaCubaCzechoslovakiaDenmarkDominicaDominican RepublicEastern AfricaEastern AsiaEastern EuropeEcuadorEgyptEl SalvadorEnglandEritreaEthiopiaEuropeFijiFranceGermanyGhanaGreeceGrenadaGuatemalaGuyanaHaitiHondurasHong KongHungaryIndiaIndonesiaIranIraqIrelandIsraelItalyJamaicaJapanJordanKazakhstanKenyaKoreaKuwaitLaosLatin AmericaLatviaLebanonLiberiaLithuaniaMalaysiaMexicoMicronesiaMiddle AfricaMoldovaMoroccoNepalNetherlandsNicaraguaNigeriaNorth AmericaNorth MacedoniaNorthern AfricaNorthern EuropeNorwayOceaniaPakistanPanamaPeruPhilippinesPolandPortugalRomaniaRussiaSaudi ArabiaScotlandSenegalSerbiaSierra LeoneSingaporeSomaliaSouth AfricaSouth AmericaSouth Central AsiaSouth Eastern AsiaSouthern EuropeSpainSri LankaSt. Vincent and the GrenadinesSudanSwedenSwitzerlandSyriaTaiwanThailandTrinidad and TobagoTurkeyUgandaUkraineUruguayUzbekistanVenezuelaVietnamWest IndiesWestern AfricaWestern AsiaWestern EuropeYemenZaireZimbabweAzores
Self-Care Disability
Income
Poverty
Unemployment
Labor Participation
Family Structure
Vehicle Availability
Education Level
Disability

German Russian Self-Care Disability
Good

2.5%
SELF-CARE DISABILITY
62.7/ 100
METRIC RATING
163rd/ 347
METRIC RANK

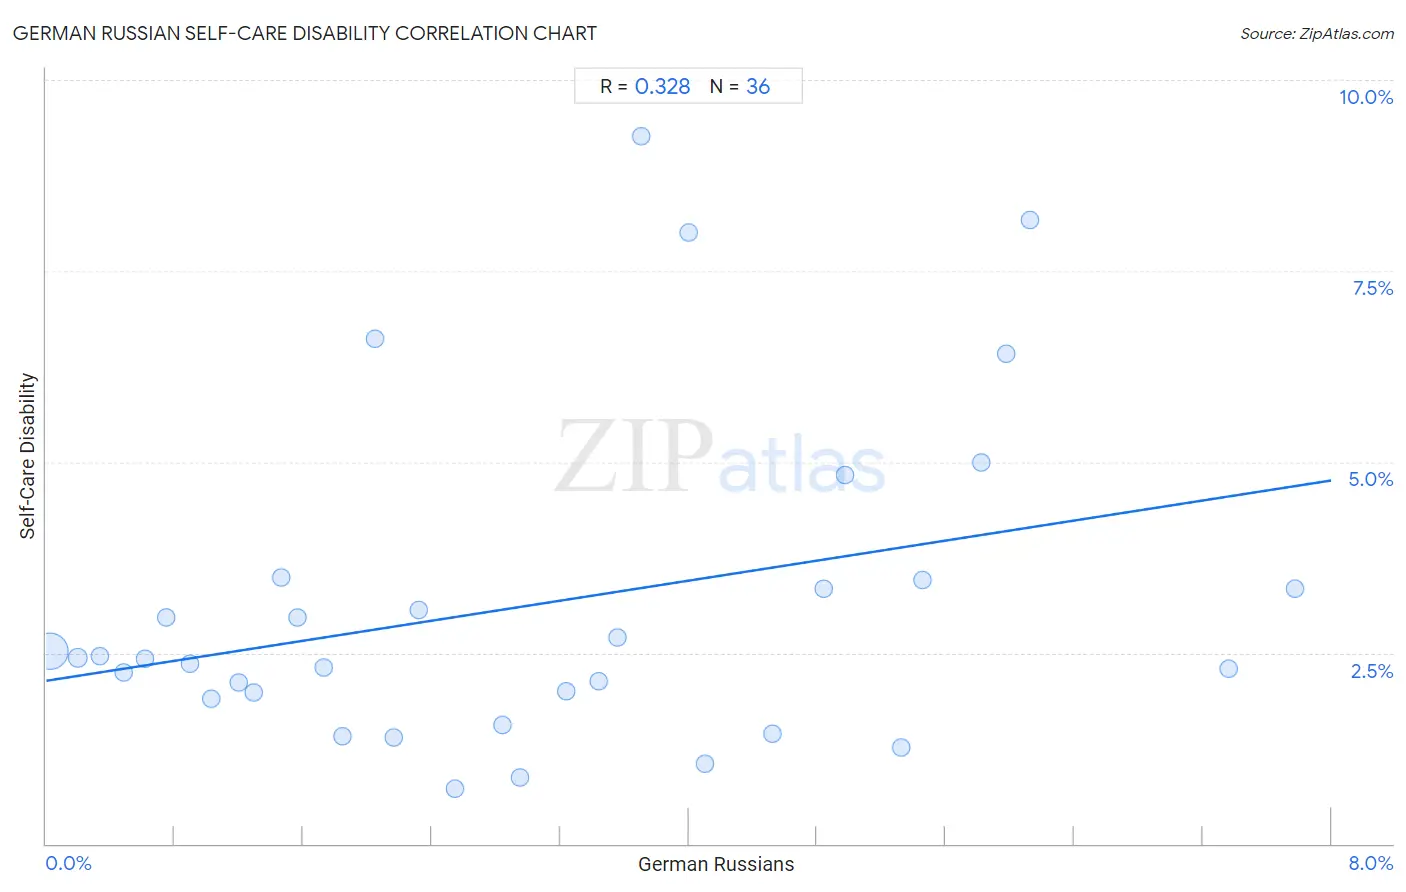
German Russian Self-Care Disability Correlation Chart

The statistical analysis conducted on geographies consisting of 96,413,483 people shows a mild positive correlation between the proportion of German Russians and percentage of population with self-care disability in the United States with a correlation coefficient (R) of 0.328 and weighted average of 2.5%. On average, for every 1% (one percent) increase in German Russians within a typical geography, there is an increase of 0.33% in percentage of population with self-care disability.
German Russian Self-Care Disability
It is essential to understand that the correlation between the percentage of German Russians and percentage of population with self-care disability does not imply a direct cause-and-effect relationship. It remains uncertain whether the presence of German Russians influences an upward or downward trend in the level of percentage of population with self-care disability within an area, or if German Russians simply ended up residing in those areas with higher or lower levels of percentage of population with self-care disability due to other factors.

Demographics Similar to German Russians by Self-Care Disability

In terms of self-care disability, the demographic groups most similar to German Russians are Somali (2.5%, a difference of 0.050%), Immigrants from Vietnam (2.5%, a difference of 0.17%), Syrian (2.5%, a difference of 0.19%), Lebanese (2.4%, a difference of 0.20%), and Canadian (2.5%, a difference of 0.20%).
DemographicsRating | RankSelf-Care Disability
Nigerians
70.6
/100
|
#156
Good
2.4%
Immigrants from Europe
69.6
/100
|
#157
Good
2.4%
Immigrants from Western Europe
68.6
/100
|
#158
Good
2.4%
Immigrants from Italy
68.5
/100
|
#159
Good
2.4%
Finns
67.0
/100
|
#160
Good
2.4%
Lebanese
66.5
/100
|
#161
Good
2.4%
Somalis
63.7
/100
|
#162
Good
2.5%
German Russians
62.7
/100
|
#163
Good
2.5%
Immigrants from Vietnam
59.3
/100
|
#164
Average
2.5%
Syrians
59.0
/100
|
#165
Average
2.5%
Canadians
58.8
/100
|
#166
Average
2.5%
Immigrants from Greece
57.3
/100
|
#167
Average
2.5%
Ute
57.1
/100
|
#168
Average
2.5%
Immigrants from Somalia
55.9
/100
|
#169
Average
2.5%
Scottish
54.3
/100
|
#170
Average
2.5%

German Russian Self-Care Disability Correlation Summary

MeasurementGerman Russian DataSelf-Care Disability Data
Minimum0.022%0.71%
Maximum7.8%9.3%
Range7.8%8.5%
Mean3.0%3.1%
Median2.7%2.4%
Interquartile 25% (IQ1)1.2%1.9%
Interquartile 75% (IQ3)4.7%3.4%
Interquartile Range (IQR)3.4%1.5%
Standard Deviation (Sample)2.1%2.1%
Standard Deviation (Population)2.1%2.1%

Correlation Details

German Russian PercentileSample SizeSelf-Care Disability
[
0.0%
-
0.5%
]
0.022%
90,573,0142.5%
[
0.0%
-
0.5%
]
0.20%
3,273,2832.4%
[
0.0%
-
0.5%
]
0.34%
1,037,9532.5%
[
0.0%
-
0.5%
]
0.48%
524,5732.2%
[
0.5%
-
1.0%
]
0.62%
278,9302.4%
[
0.5%
-
1.0%
]
0.74%
218,6643.0%
[
0.5%
-
1.0%
]
0.89%
56,0952.4%
[
1.0%
-
1.5%
]
1.03%
147,6111.9%
[
1.0%
-
1.5%
]
1.20%
95,5962.1%
[
1.0%
-
1.5%
]
1.29%
73,4332.0%
[
1.0%
-
1.5%
]
1.46%
5,1323.5%
[
1.5%
-
2.0%
]
1.56%
43,3673.0%
[
1.5%
-
2.0%
]
1.73%
1,6182.3%
[
1.5%
-
2.0%
]
1.85%
32,9981.4%
[
2.0%
-
2.5%
]
2.05%
5,9086.6%
[
2.0%
-
2.5%
]
2.16%
9,2091.4%
[
2.0%
-
2.5%
]
2.32%
7,9383.1%
[
2.5%
-
3.0%
]
2.54%
2,3970.71%
[
2.5%
-
3.0%
]
2.84%
2,6791.6%
[
2.5%
-
3.0%
]
2.95%
6110.86%
[
3.0%
-
3.5%
]
3.23%
2,2882.0%
[
3.0%
-
3.5%
]
3.44%
1,2802.1%
[
3.5%
-
4.0%
]
3.56%
12,5932.7%
[
3.5%
-
4.0%
]
3.70%
549.3%
[
4.0%
-
4.5%
]
4.00%
258.0%
[
4.0%
-
4.5%
]
4.10%
2,2431.0%
[
4.5%
-
5.0%
]
4.52%
9511.4%
[
4.5%
-
5.0%
]
4.84%
623.3%
[
4.5%
-
5.0%
]
4.97%
5234.8%
[
5.0%
-
5.5%
]
5.32%
8081.3%
[
5.0%
-
5.5%
]
5.45%
1103.4%
[
5.5%
-
6.0%
]
5.82%
4645.0%
[
5.5%
-
6.0%
]
5.97%
7036.4%
[
6.0%
-
6.5%
]
6.12%
498.2%
[
7.0%
-
7.5%
]
7.36%
2312.3%
[
7.5%
-
8.0%
]
7.78%
903.3%