Scotch-Irish Single Mother Households

COMPARE

Scotch-Irish
Race
Ancestry
AfghanAfricanAlaska NativeAlaskan AthabascanAlbanianAleutAlsatianAmericanApacheArabArapahoArgentineanArmenianAssyrian/Chaldean/SyriacAustralianAustrianBahamianBangladeshiBarbadianBasqueBelgianBelizeanBermudanBhutaneseBlackfeetBolivianBrazilianBritishBritish West IndianBulgarianBurmeseCajunCambodianCanadianCape VerdeanCarpatho RusynCelticCentral AmericanCentral American IndianCherokeeCheyenneChickasawChileanChineseChippewaChoctawColombianColvilleComancheCosta RicanCreeCreekCroatianCrowCubanCypriotCzechCzechoslovakianDanishDelawareDominicanDutchDutch West IndianEastern EuropeanEcuadorianEgyptianEnglishEstonianEthiopianEuropeanFijianFilipinoFinnishFrenchFrench American IndianFrench CanadianGermanGerman RussianGhanaianGreekGuamanian/ChamorroGuatemalanGuyaneseHaitianHmongHonduranHopiHoumaHungarianIcelanderIndian (Asian)IndonesianInupiatIranianIraqiIrishIroquoisIsraeliItalianJamaicanJapaneseJordanianKenyanKiowaKoreanLaotianLatvianLebaneseLiberianLithuanianLumbeeLuxembourgerMacedonianMalaysianMalteseMarshalleseMenomineeMexicanMexican American IndianMongolianMoroccanNative HawaiianNavajoNepaleseNew ZealanderNicaraguanNigerianNorthern EuropeanNorwegianOkinawanOsageOttawaPaiutePakistaniPalestinianPanamanianParaguayanPennsylvania GermanPeruvianPimaPolishPortuguesePotawatomiPuebloPuerto RicanPuget Sound SalishRomanianRussianSalvadoranSamoanScandinavianScotch-IrishScottishSeminoleSenegaleseSerbianShoshoneSierra LeoneanSiouxSlavicSlovakSloveneSomaliSouth AfricanSouth AmericanSouth American IndianSoviet UnionSpaniardSpanishSpanish AmericanSpanish American IndianSri LankanSubsaharan AfricanSudaneseSwedishSwissSyrianTaiwaneseThaiTlingit-HaidaTohono O'OdhamTonganTrinidadian and TobagonianTsimshianTurkishU.S. Virgin IslanderUgandanUkrainianUruguayanUteVenezuelanVietnameseWelshWest IndianYakamaYaquiYugoslavianYumanYup'ikZimbabwean
Immigration
NonimmigrantsImmigrantsAfghanistanAfricaAlbaniaArgentinaArmeniaAsiaAustraliaAustriaBahamasBangladeshBarbadosBelarusBelgiumBelizeBoliviaBosnia and HerzegovinaBrazilBulgariaBurma/MyanmarCabo VerdeCambodiaCameroonCanadaCaribbeanCentral AmericaChileChinaColombiaCongoCosta RicaCroatiaCubaCzechoslovakiaDenmarkDominicaDominican RepublicEastern AfricaEastern AsiaEastern EuropeEcuadorEgyptEl SalvadorEnglandEritreaEthiopiaEuropeFijiFranceGermanyGhanaGreeceGrenadaGuatemalaGuyanaHaitiHondurasHong KongHungaryIndiaIndonesiaIranIraqIrelandIsraelItalyJamaicaJapanJordanKazakhstanKenyaKoreaKuwaitLaosLatin AmericaLatviaLebanonLiberiaLithuaniaMalaysiaMexicoMicronesiaMiddle AfricaMoldovaMoroccoNepalNetherlandsNicaraguaNigeriaNorth AmericaNorth MacedoniaNorthern AfricaNorthern EuropeNorwayOceaniaPakistanPanamaPeruPhilippinesPolandPortugalRomaniaRussiaSaudi ArabiaScotlandSenegalSerbiaSierra LeoneSingaporeSomaliaSouth AfricaSouth AmericaSouth Central AsiaSouth Eastern AsiaSouthern EuropeSpainSri LankaSt. Vincent and the GrenadinesSudanSwedenSwitzerlandSyriaTaiwanThailandTrinidad and TobagoTurkeyUgandaUkraineUruguayUzbekistanVenezuelaVietnamWest IndiesWestern AfricaWestern AsiaWestern EuropeYemenZaireZimbabweAzores
Select to Compare
Race
Ancestry
AfghanAfricanAlaska NativeAlaskan AthabascanAlbanianAleutAlsatianAmericanApacheArabArapahoArgentineanArmenianAssyrian/Chaldean/SyriacAustralianAustrianBahamianBangladeshiBarbadianBasqueBelgianBelizeanBermudanBhutaneseBlackfeetBolivianBrazilianBritishBritish West IndianBulgarianBurmeseCajunCambodianCanadianCape VerdeanCarpatho RusynCelticCentral AmericanCentral American IndianCherokeeCheyenneChickasawChileanChineseChippewaChoctawColombianColvilleComancheCosta RicanCreeCreekCroatianCrowCubanCypriotCzechCzechoslovakianDanishDelawareDominicanDutchDutch West IndianEastern EuropeanEcuadorianEgyptianEnglishEstonianEthiopianEuropeanFijianFilipinoFinnishFrenchFrench American IndianFrench CanadianGermanGerman RussianGhanaianGreekGuamanian/ChamorroGuatemalanGuyaneseHaitianHmongHonduranHopiHoumaHungarianIcelanderIndian (Asian)IndonesianInupiatIranianIraqiIrishIroquoisIsraeliItalianJamaicanJapaneseJordanianKenyanKiowaKoreanLaotianLatvianLebaneseLiberianLithuanianLumbeeLuxembourgerMacedonianMalaysianMalteseMarshalleseMenomineeMexicanMexican American IndianMongolianMoroccanNative HawaiianNavajoNepaleseNew ZealanderNicaraguanNigerianNorthern EuropeanNorwegianOkinawanOsageOttawaPaiutePakistaniPalestinianPanamanianParaguayanPennsylvania GermanPeruvianPimaPolishPortuguesePotawatomiPuebloPuerto RicanPuget Sound SalishRomanianRussianSalvadoranSamoanScandinavianScottishSeminoleSenegaleseSerbianShoshoneSierra LeoneanSiouxSlavicSlovakSloveneSomaliSouth AfricanSouth AmericanSouth American IndianSoviet UnionSpaniardSpanishSpanish AmericanSpanish American IndianSri LankanSubsaharan AfricanSudaneseSwedishSwissSyrianTaiwaneseThaiTlingit-HaidaTohono O'OdhamTonganTrinidadian and TobagonianTsimshianTurkishU.S. Virgin IslanderUgandanUkrainianUruguayanUteVenezuelanVietnameseWelshWest IndianYakamaYaquiYugoslavianYumanYup'ikZimbabwean
Immigration
NonimmigrantsImmigrantsAfghanistanAfricaAlbaniaArgentinaArmeniaAsiaAustraliaAustriaBahamasBangladeshBarbadosBelarusBelgiumBelizeBoliviaBosnia and HerzegovinaBrazilBulgariaBurma/MyanmarCabo VerdeCambodiaCameroonCanadaCaribbeanCentral AmericaChileChinaColombiaCongoCosta RicaCroatiaCubaCzechoslovakiaDenmarkDominicaDominican RepublicEastern AfricaEastern AsiaEastern EuropeEcuadorEgyptEl SalvadorEnglandEritreaEthiopiaEuropeFijiFranceGermanyGhanaGreeceGrenadaGuatemalaGuyanaHaitiHondurasHong KongHungaryIndiaIndonesiaIranIraqIrelandIsraelItalyJamaicaJapanJordanKazakhstanKenyaKoreaKuwaitLaosLatin AmericaLatviaLebanonLiberiaLithuaniaMalaysiaMexicoMicronesiaMiddle AfricaMoldovaMoroccoNepalNetherlandsNicaraguaNigeriaNorth AmericaNorth MacedoniaNorthern AfricaNorthern EuropeNorwayOceaniaPakistanPanamaPeruPhilippinesPolandPortugalRomaniaRussiaSaudi ArabiaScotlandSenegalSerbiaSierra LeoneSingaporeSomaliaSouth AfricaSouth AmericaSouth Central AsiaSouth Eastern AsiaSouthern EuropeSpainSri LankaSt. Vincent and the GrenadinesSudanSwedenSwitzerlandSyriaTaiwanThailandTrinidad and TobagoTurkeyUgandaUkraineUruguayUzbekistanVenezuelaVietnamWest IndiesWestern AfricaWestern AsiaWestern EuropeYemenZaireZimbabweAzores
Single Mother Households
Income
Poverty
Unemployment
Labor Participation
Family Structure
Vehicle Availability
Education Level
Disability

Scotch-Irish Single Mother Households
Excellent

6.0%
SINGLE MOTHER HOUSEHOLDS
82.0/ 100
METRIC RATING
148th/ 347
METRIC RANK

Scotch-Irish Single Mother Households Correlation Chart

The statistical analysis conducted on geographies consisting of 544,486,743 people shows a mild positive correlation between the proportion of Scotch-Irish and percentage of single mother households in the United States with a correlation coefficient (R) of 0.331 and weighted average of 6.0%. On average, for every 1% (one percent) increase in Scotch-Irish within a typical geography, there is an increase of 0.16% in percentage of single mother households.
Scotch-Irish Single Mother Households
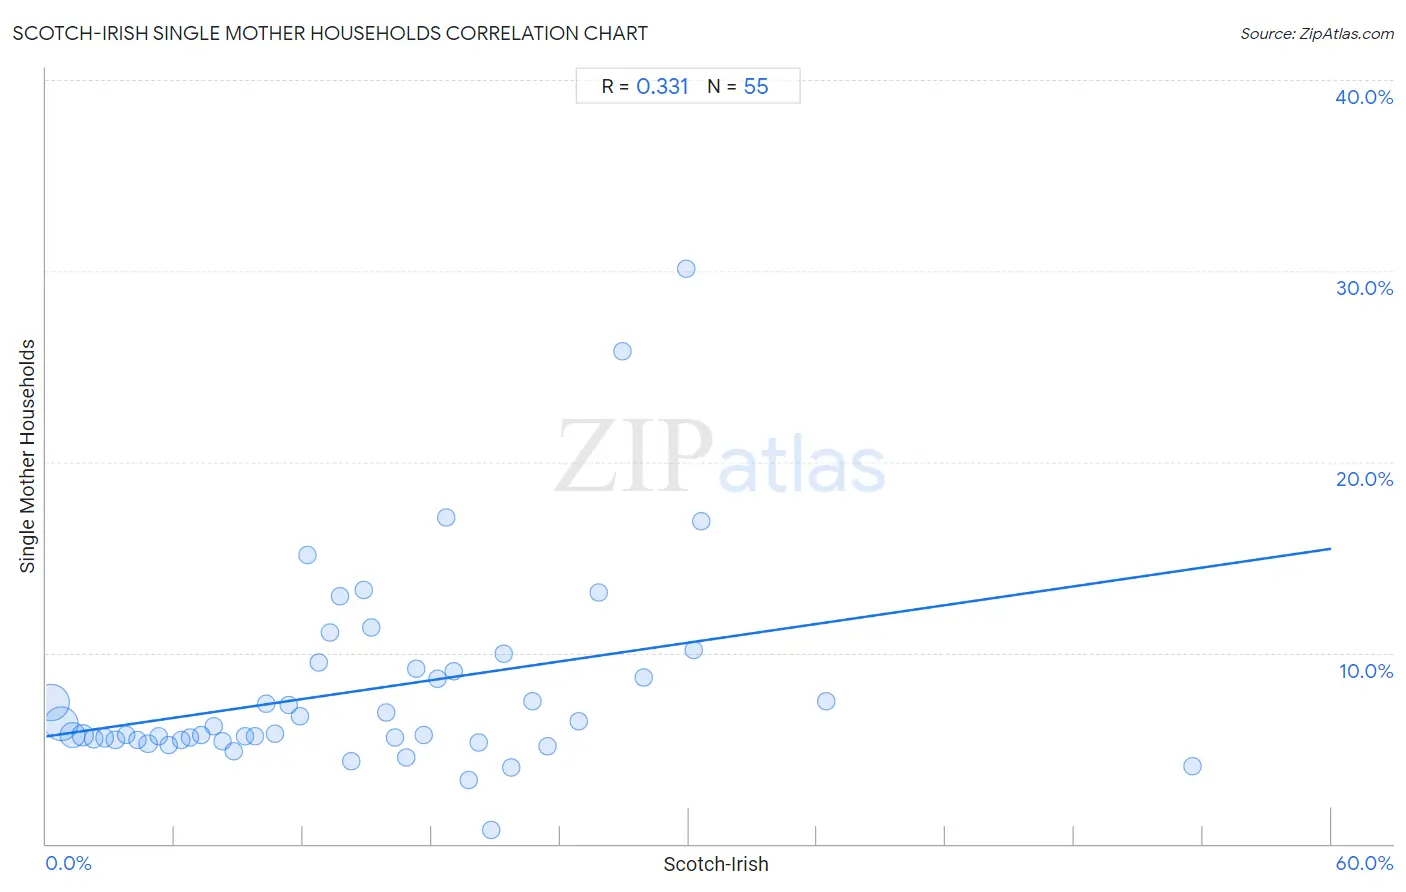
It is essential to understand that the correlation between the percentage of Scotch-Irish and percentage of single mother households does not imply a direct cause-and-effect relationship. It remains uncertain whether the presence of Scotch-Irish influences an upward or downward trend in the level of percentage of single mother households within an area, or if Scotch-Irish simply ended up residing in those areas with higher or lower levels of percentage of single mother households due to other factors.

Demographics Similar to Scotch-Irish by Single Mother Households

In terms of single mother households, the demographic groups most similar to Scotch-Irish are Immigrants from Jordan (6.0%, a difference of 0.050%), Immigrants from Albania (6.1%, a difference of 0.10%), French Canadian (6.0%, a difference of 0.11%), Zimbabwean (6.1%, a difference of 0.24%), and Immigrants from Southern Europe (6.1%, a difference of 0.30%).
DemographicsRating | RankSingle Mother Households
Tsimshian
85.2
/100
|
#141
Excellent
6.0%
Immigrants from Egypt
85.0
/100
|
#142
Excellent
6.0%
Immigrants from Iraq
84.8
/100
|
#143
Excellent
6.0%
Koreans
84.4
/100
|
#144
Excellent
6.0%
Arabs
84.0
/100
|
#145
Excellent
6.0%
French Canadians
82.6
/100
|
#146
Excellent
6.0%
Immigrants from Jordan
82.3
/100
|
#147
Excellent
6.0%
Scotch-Irish
82.0
/100
|
#148
Excellent
6.0%
Immigrants from Albania
81.5
/100
|
#149
Excellent
6.1%
Zimbabweans
80.7
/100
|
#150
Excellent
6.1%
Immigrants from Southern Europe
80.5
/100
|
#151
Excellent
6.1%
Pakistanis
79.2
/100
|
#152
Good
6.1%
Immigrants from Brazil
78.9
/100
|
#153
Good
6.1%
Immigrants from Philippines
78.5
/100
|
#154
Good
6.1%
Whites/Caucasians
76.5
/100
|
#155
Good
6.1%

Scotch-Irish Single Mother Households Correlation Summary

MeasurementScotch-Irish DataSingle Mother Households Data
Minimum0.25%0.72%
Maximum53.5%30.1%
Range53.3%29.4%
Mean14.8%8.1%
Median13.7%5.8%
Interquartile 25% (IQ1)6.7%5.4%
Interquartile 75% (IQ3)20.8%9.1%
Interquartile Range (IQR)14.1%3.7%
Standard Deviation (Sample)10.3%5.1%
Standard Deviation (Population)10.2%5.1%

Correlation Details

Scotch-Irish PercentileSample SizeSingle Mother Households
[
0.0%
-
0.5%
]
0.25%
209,841,0187.4%
[
0.5%
-
1.0%
]
0.72%
182,341,9026.3%
[
1.0%
-
1.5%
]
1.21%
82,090,6515.7%
[
1.5%
-
2.0%
]
1.72%
35,864,5405.7%
[
2.0%
-
2.5%
]
2.21%
15,659,9085.5%
[
2.5%
-
3.0%
]
2.73%
7,670,6635.6%
[
3.0%
-
3.5%
]
3.23%
5,011,1205.4%
[
3.5%
-
4.0%
]
3.75%
2,366,5855.7%
[
4.0%
-
4.5%
]
4.25%
1,217,7975.4%
[
4.5%
-
5.0%
]
4.75%
693,0765.2%
[
5.0%
-
5.5%
]
5.23%
600,6975.6%
[
5.5%
-
6.0%
]
5.72%
294,1755.2%
[
6.0%
-
6.5%
]
6.29%
178,5385.4%
[
6.5%
-
7.0%
]
6.70%
114,9125.5%
[
7.0%
-
7.5%
]
7.22%
99,6615.7%
[
7.5%
-
8.0%
]
7.80%
91,3726.2%
[
8.0%
-
8.5%
]
8.21%
63,6525.4%
[
8.5%
-
9.0%
]
8.75%
51,4684.8%
[
9.0%
-
9.5%
]
9.26%
30,9475.6%
[
9.5%
-
10.0%
]
9.74%
24,6195.6%
[
10.0%
-
10.5%
]
10.28%
30,0667.3%
[
10.5%
-
11.0%
]
10.66%
20,6615.8%
[
11.0%
-
11.5%
]
11.30%
11,6217.3%
[
11.5%
-
12.0%
]
11.84%
10,9776.7%
[
12.0%
-
12.5%
]
12.17%
5,51315.1%
[
12.5%
-
13.0%
]
12.74%
2,8889.5%
[
13.0%
-
13.5%
]
13.22%
17,13311.1%
[
13.5%
-
14.0%
]
13.70%
14,62912.9%
[
14.0%
-
14.5%
]
14.24%
13,4234.3%
[
14.5%
-
15.0%
]
14.82%
1,84213.3%
[
15.0%
-
15.5%
]
15.15%
4,52011.4%
[
15.5%
-
16.0%
]
15.87%
4,5386.9%
[
16.0%
-
16.5%
]
16.28%
6,9275.6%
[
16.5%
-
17.0%
]
16.81%
5,1044.5%
[
17.0%
-
17.5%
]
17.26%
5,4299.1%
[
17.5%
-
18.0%
]
17.61%
6,8605.7%
[
18.0%
-
18.5%
]
18.30%
2,0448.6%
[
18.5%
-
19.0%
]
18.65%
2,91717.1%
[
19.0%
-
19.5%
]
19.03%
5579.0%
[
19.5%
-
20.0%
]
19.71%
9743.3%
[
20.0%
-
20.5%
]
20.19%
2085.3%
[
20.5%
-
21.0%
]
20.77%
1,2710.72%
[
21.0%
-
21.5%
]
21.34%
73110.0%
[
21.5%
-
22.0%
]
21.73%
9394.0%
[
22.5%
-
23.0%
]
22.71%
9607.5%
[
23.0%
-
23.5%
]
23.42%
1,0295.1%
[
24.5%
-
25.0%
]
24.86%
1736.4%
[
25.5%
-
26.0%
]
25.80%
40713.2%
[
26.5%
-
27.0%
]
26.92%
36425.8%
[
27.5%
-
28.0%
]
27.91%
868.7%
[
29.5%
-
30.0%
]
29.91%
66230.1%
[
30.0%
-
30.5%
]
30.24%
2,57610.1%
[
30.5%
-
31.0%
]
30.57%
38616.9%
[
36.0%
-
36.5%
]
36.40%
7287.4%
[
53.5%
-
54.0%
]
53.51%
2994.0%