Scotch-Irish Cognitive Disability
COMPARE
Scotch-Irish
Select to Compare
Cognitive Disability
Scotch-Irish Cognitive Disability
17.1%
COGNITIVE DISABILITY
85.9/ 100
METRIC RATING
147th/ 347
METRIC RANK
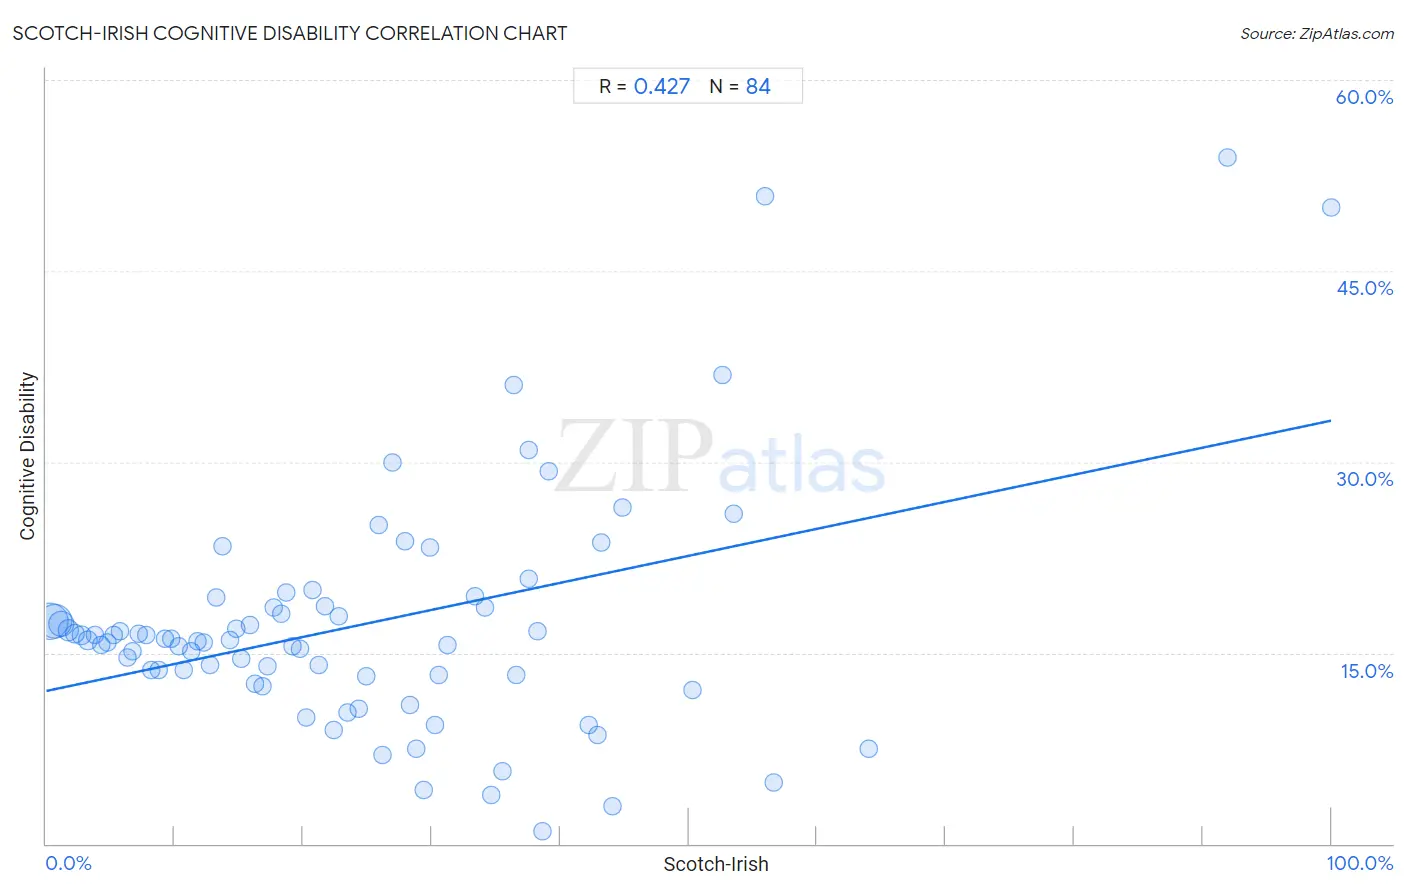
Scotch-Irish Cognitive Disability Correlation Chart
The statistical analysis conducted on geographies consisting of 548,652,939 people shows a moderate positive correlation between the proportion of Scotch-Irish and percentage of population with cognitive disability in the United States with a correlation coefficient (R) of 0.427 and weighted average of 17.1%. On average, for every 1% (one percent) increase in Scotch-Irish within a typical geography, there is an increase of 0.21% in percentage of population with cognitive disability.
It is essential to understand that the correlation between the percentage of Scotch-Irish and percentage of population with cognitive disability does not imply a direct cause-and-effect relationship. It remains uncertain whether the presence of Scotch-Irish influences an upward or downward trend in the level of percentage of population with cognitive disability within an area, or if Scotch-Irish simply ended up residing in those areas with higher or lower levels of percentage of population with cognitive disability due to other factors.
Demographics Similar to Scotch-Irish by Cognitive Disability
In terms of cognitive disability, the demographic groups most similar to Scotch-Irish are French Canadian (17.1%, a difference of 0.010%), Cypriot (17.1%, a difference of 0.010%), Basque (17.1%, a difference of 0.030%), Costa Rican (17.0%, a difference of 0.13%), and Syrian (17.1%, a difference of 0.16%).
| Demographics | Rating | Rank | Cognitive Disability |
| Chileans | 89.9 /100 | #140 | Excellent 17.0% |
| Aleuts | 89.9 /100 | #141 | Excellent 17.0% |
| Carpatho Rusyns | 89.6 /100 | #142 | Excellent 17.0% |
| British | 89.3 /100 | #143 | Excellent 17.0% |
| Immigrants from Brazil | 89.3 /100 | #144 | Excellent 17.0% |
| Immigrants from South Eastern Asia | 88.7 /100 | #145 | Excellent 17.0% |
| Costa Ricans | 88.0 /100 | #146 | Excellent 17.0% |
| Scotch-Irish | 85.9 /100 | #147 | Excellent 17.1% |
| French Canadians | 85.7 /100 | #148 | Excellent 17.1% |
| Cypriots | 85.7 /100 | #149 | Excellent 17.1% |
| Basques | 85.5 /100 | #150 | Excellent 17.1% |
| Syrians | 83.0 /100 | #151 | Excellent 17.1% |
| Immigrants from Indonesia | 82.7 /100 | #152 | Excellent 17.1% |
| Immigrants from Kazakhstan | 80.5 /100 | #153 | Excellent 17.1% |
| Immigrants from Malaysia | 79.3 /100 | #154 | Good 17.1% |
Scotch-Irish Cognitive Disability Correlation Summary
| Measurement | Scotch-Irish Data | Cognitive Disability Data |
| Minimum | 0.25% | 0.99% |
| Maximum | 100.0% | 53.9% |
| Range | 99.7% | 52.9% |
| Mean | 24.5% | 17.2% |
| Median | 21.0% | 16.0% |
| Interquartile 25% (IQ1) | 10.5% | 13.2% |
| Interquartile 75% (IQ3) | 35.0% | 18.6% |
| Interquartile Range (IQR) | 24.5% | 5.4% |
| Standard Deviation (Sample) | 18.9% | 9.4% |
| Standard Deviation (Population) | 18.8% | 9.3% |
Correlation Details
| Scotch-Irish Percentile | Sample Size | Cognitive Disability |
[ 0.0% - 0.5% ] 0.25% | 210,760,146 | 17.5% |
[ 0.5% - 1.0% ] 0.72% | 183,275,664 | 17.5% |
[ 1.0% - 1.5% ] 1.21% | 82,711,061 | 17.3% |
[ 1.5% - 2.0% ] 1.72% | 36,475,735 | 16.8% |
[ 2.0% - 2.5% ] 2.21% | 15,912,524 | 16.5% |
[ 2.5% - 3.0% ] 2.73% | 7,865,042 | 16.4% |
[ 3.0% - 3.5% ] 3.23% | 5,133,460 | 16.0% |
[ 3.5% - 4.0% ] 3.75% | 2,462,942 | 16.4% |
[ 4.0% - 4.5% ] 4.25% | 1,279,387 | 15.7% |
[ 4.5% - 5.0% ] 4.76% | 749,530 | 15.8% |
[ 5.0% - 5.5% ] 5.23% | 644,262 | 16.4% |
[ 5.5% - 6.0% ] 5.71% | 327,998 | 16.7% |
[ 6.0% - 6.5% ] 6.29% | 211,463 | 14.7% |
[ 6.5% - 7.0% ] 6.71% | 139,832 | 15.1% |
[ 7.0% - 7.5% ] 7.24% | 122,924 | 16.5% |
[ 7.5% - 8.0% ] 7.79% | 113,202 | 16.4% |
[ 8.0% - 8.5% ] 8.22% | 76,560 | 13.7% |
[ 8.5% - 9.0% ] 8.75% | 61,289 | 13.7% |
[ 9.0% - 9.5% ] 9.25% | 40,277 | 16.1% |
[ 9.5% - 10.0% ] 9.76% | 38,625 | 16.1% |
[ 10.0% - 10.5% ] 10.27% | 38,479 | 15.5% |
[ 10.5% - 11.0% ] 10.70% | 27,304 | 13.7% |
[ 11.0% - 11.5% ] 11.24% | 19,855 | 15.2% |
[ 11.5% - 12.0% ] 11.80% | 17,350 | 15.9% |
[ 12.0% - 12.5% ] 12.23% | 9,362 | 15.8% |
[ 12.5% - 13.0% ] 12.75% | 5,104 | 14.1% |
[ 13.0% - 13.5% ] 13.22% | 19,080 | 19.3% |
[ 13.5% - 14.0% ] 13.70% | 16,805 | 23.3% |
[ 14.0% - 14.5% ] 14.26% | 16,146 | 16.0% |
[ 14.5% - 15.0% ] 14.83% | 3,466 | 16.9% |
[ 15.0% - 15.5% ] 15.17% | 6,541 | 14.5% |
[ 15.5% - 16.0% ] 15.86% | 5,600 | 17.1% |
[ 16.0% - 16.5% ] 16.21% | 11,008 | 12.6% |
[ 16.5% - 17.0% ] 16.81% | 5,181 | 12.4% |
[ 17.0% - 17.5% ] 17.25% | 8,040 | 14.0% |
[ 17.5% - 18.0% ] 17.66% | 9,676 | 18.5% |
[ 18.0% - 18.5% ] 18.30% | 2,300 | 18.1% |
[ 18.5% - 19.0% ] 18.65% | 2,917 | 19.7% |
[ 19.0% - 19.5% ] 19.19% | 2,236 | 15.5% |
[ 19.5% - 20.0% ] 19.72% | 1,273 | 15.3% |
[ 20.0% - 20.5% ] 20.25% | 716 | 9.9% |
[ 20.5% - 21.0% ] 20.72% | 2,645 | 20.0% |
[ 21.0% - 21.5% ] 21.24% | 1,290 | 14.0% |
[ 21.5% - 22.0% ] 21.72% | 1,805 | 18.7% |
[ 22.0% - 22.5% ] 22.39% | 67 | 9.0% |
[ 22.5% - 23.0% ] 22.77% | 1,458 | 17.9% |
[ 23.0% - 23.5% ] 23.48% | 903 | 10.3% |
[ 24.0% - 24.5% ] 24.31% | 288 | 10.6% |
[ 24.5% - 25.0% ] 24.87% | 1,773 | 13.2% |
[ 25.5% - 26.0% ] 25.83% | 724 | 25.0% |
[ 26.0% - 26.5% ] 26.16% | 237 | 7.0% |
[ 26.5% - 27.0% ] 26.92% | 364 | 29.9% |
[ 27.5% - 28.0% ] 27.93% | 179 | 23.7% |
[ 28.0% - 28.5% ] 28.26% | 92 | 10.9% |
[ 28.5% - 29.0% ] 28.81% | 361 | 7.5% |
[ 29.0% - 29.5% ] 29.42% | 469 | 4.2% |
[ 29.5% - 30.0% ] 29.83% | 905 | 23.3% |
[ 30.0% - 30.5% ] 30.26% | 2,991 | 9.3% |
[ 30.5% - 31.0% ] 30.57% | 386 | 13.2% |
[ 31.0% - 31.5% ] 31.25% | 32 | 15.6% |
[ 33.0% - 33.5% ] 33.33% | 36 | 19.4% |
[ 34.0% - 34.5% ] 34.17% | 1,080 | 18.5% |
[ 34.5% - 35.0% ] 34.59% | 185 | 3.8% |
[ 35.0% - 35.5% ] 35.46% | 141 | 5.7% |
[ 36.0% - 36.5% ] 36.40% | 728 | 36.0% |
[ 36.5% - 37.0% ] 36.53% | 605 | 13.3% |
[ 37.0% - 37.5% ] 37.50% | 72 | 20.8% |
[ 37.5% - 38.0% ] 37.58% | 157 | 30.9% |
[ 38.0% - 38.5% ] 38.18% | 55 | 16.7% |
[ 38.5% - 39.0% ] 38.61% | 101 | 0.99% |
[ 39.0% - 39.5% ] 39.08% | 87 | 29.3% |
[ 42.0% - 42.5% ] 42.19% | 64 | 9.4% |
[ 42.5% - 43.0% ] 42.86% | 35 | 8.6% |
[ 43.0% - 43.5% ] 43.17% | 556 | 23.7% |
[ 44.0% - 44.5% ] 44.08% | 338 | 2.9% |
[ 44.5% - 45.0% ] 44.84% | 339 | 26.4% |
[ 50.0% - 50.5% ] 50.34% | 149 | 12.1% |
[ 52.5% - 53.0% ] 52.63% | 38 | 36.8% |
[ 53.5% - 54.0% ] 53.51% | 299 | 25.9% |
[ 55.5% - 56.0% ] 55.93% | 59 | 50.8% |
[ 56.5% - 57.0% ] 56.63% | 83 | 4.8% |
[ 64.0% - 64.5% ] 64.00% | 175 | 7.4% |
[ 91.5% - 92.0% ] 91.89% | 222 | 53.9% |
[ 99.5% - 100.0% ] 100.00% | 4 | 50.0% |