Immigrants from West Indies Self-Care Disability

COMPARE

Immigrants from West Indies
Race
Ancestry
AfghanAfricanAlaska NativeAlaskan AthabascanAlbanianAleutAlsatianAmericanApacheArabArapahoArgentineanArmenianAssyrian/Chaldean/SyriacAustralianAustrianBahamianBangladeshiBarbadianBasqueBelgianBelizeanBermudanBhutaneseBlackfeetBolivianBrazilianBritishBritish West IndianBulgarianBurmeseCajunCambodianCanadianCape VerdeanCarpatho RusynCelticCentral AmericanCentral American IndianCherokeeCheyenneChickasawChileanChineseChippewaChoctawColombianColvilleComancheCosta RicanCreeCreekCroatianCrowCubanCypriotCzechCzechoslovakianDanishDelawareDominicanDutchDutch West IndianEastern EuropeanEcuadorianEgyptianEnglishEstonianEthiopianEuropeanFijianFilipinoFinnishFrenchFrench American IndianFrench CanadianGermanGerman RussianGhanaianGreekGuamanian/ChamorroGuatemalanGuyaneseHaitianHmongHonduranHopiHoumaHungarianIcelanderIndian (Asian)IndonesianInupiatIranianIraqiIrishIroquoisIsraeliItalianJamaicanJapaneseJordanianKenyanKiowaKoreanLaotianLatvianLebaneseLiberianLithuanianLumbeeLuxembourgerMacedonianMalaysianMalteseMarshalleseMenomineeMexicanMexican American IndianMongolianMoroccanNative HawaiianNavajoNepaleseNew ZealanderNicaraguanNigerianNorthern EuropeanNorwegianOkinawanOsageOttawaPaiutePakistaniPalestinianPanamanianParaguayanPennsylvania GermanPeruvianPimaPolishPortuguesePotawatomiPuebloPuerto RicanPuget Sound SalishRomanianRussianSalvadoranSamoanScandinavianScotch-IrishScottishSeminoleSenegaleseSerbianShoshoneSierra LeoneanSiouxSlavicSlovakSloveneSomaliSouth AfricanSouth AmericanSouth American IndianSoviet UnionSpaniardSpanishSpanish AmericanSpanish American IndianSri LankanSubsaharan AfricanSudaneseSwedishSwissSyrianTaiwaneseThaiTlingit-HaidaTohono O'OdhamTonganTrinidadian and TobagonianTsimshianTurkishU.S. Virgin IslanderUgandanUkrainianUruguayanUteVenezuelanVietnameseWelshWest IndianYakamaYaquiYugoslavianYumanYup'ikZimbabwean
Immigration
NonimmigrantsImmigrantsAfghanistanAfricaAlbaniaArgentinaArmeniaAsiaAustraliaAustriaBahamasBangladeshBarbadosBelarusBelgiumBelizeBoliviaBosnia and HerzegovinaBrazilBulgariaBurma/MyanmarCabo VerdeCambodiaCameroonCanadaCaribbeanCentral AmericaChileChinaColombiaCongoCosta RicaCroatiaCubaCzechoslovakiaDenmarkDominicaDominican RepublicEastern AfricaEastern AsiaEastern EuropeEcuadorEgyptEl SalvadorEnglandEritreaEthiopiaEuropeFijiFranceGermanyGhanaGreeceGrenadaGuatemalaGuyanaHaitiHondurasHong KongHungaryIndiaIndonesiaIranIraqIrelandIsraelItalyJamaicaJapanJordanKazakhstanKenyaKoreaKuwaitLaosLatin AmericaLatviaLebanonLiberiaLithuaniaMalaysiaMexicoMicronesiaMiddle AfricaMoldovaMoroccoNepalNetherlandsNicaraguaNigeriaNorth AmericaNorth MacedoniaNorthern AfricaNorthern EuropeNorwayOceaniaPakistanPanamaPeruPhilippinesPolandPortugalRomaniaRussiaSaudi ArabiaScotlandSenegalSerbiaSierra LeoneSingaporeSomaliaSouth AfricaSouth AmericaSouth Central AsiaSouth Eastern AsiaSouthern EuropeSpainSri LankaSt. Vincent and the GrenadinesSudanSwedenSwitzerlandSyriaTaiwanThailandTrinidad and TobagoTurkeyUgandaUkraineUruguayUzbekistanVenezuelaVietnamWest IndiesWestern AfricaWestern AsiaWestern EuropeYemenZaireZimbabweAzores
Select to Compare
Race
Ancestry
AfghanAfricanAlaska NativeAlaskan AthabascanAlbanianAleutAlsatianAmericanApacheArabArapahoArgentineanArmenianAssyrian/Chaldean/SyriacAustralianAustrianBahamianBangladeshiBarbadianBasqueBelgianBelizeanBermudanBhutaneseBlackfeetBolivianBrazilianBritishBritish West IndianBulgarianBurmeseCajunCambodianCanadianCape VerdeanCarpatho RusynCelticCentral AmericanCentral American IndianCherokeeCheyenneChickasawChileanChineseChippewaChoctawColombianColvilleComancheCosta RicanCreeCreekCroatianCrowCubanCypriotCzechCzechoslovakianDanishDelawareDominicanDutchDutch West IndianEastern EuropeanEcuadorianEgyptianEnglishEstonianEthiopianEuropeanFijianFilipinoFinnishFrenchFrench American IndianFrench CanadianGermanGerman RussianGhanaianGreekGuamanian/ChamorroGuatemalanGuyaneseHaitianHmongHonduranHopiHoumaHungarianIcelanderIndian (Asian)IndonesianInupiatIranianIraqiIrishIroquoisIsraeliItalianJamaicanJapaneseJordanianKenyanKiowaKoreanLaotianLatvianLebaneseLiberianLithuanianLumbeeLuxembourgerMacedonianMalaysianMalteseMarshalleseMenomineeMexicanMexican American IndianMongolianMoroccanNative HawaiianNavajoNepaleseNew ZealanderNicaraguanNigerianNorthern EuropeanNorwegianOkinawanOsageOttawaPaiutePakistaniPalestinianPanamanianParaguayanPennsylvania GermanPeruvianPimaPolishPortuguesePotawatomiPuebloPuerto RicanPuget Sound SalishRomanianRussianSalvadoranSamoanScandinavianScotch-IrishScottishSeminoleSenegaleseSerbianShoshoneSierra LeoneanSiouxSlavicSlovakSloveneSomaliSouth AfricanSouth AmericanSouth American IndianSoviet UnionSpaniardSpanishSpanish AmericanSpanish American IndianSri LankanSubsaharan AfricanSudaneseSwedishSwissSyrianTaiwaneseThaiTlingit-HaidaTohono O'OdhamTonganTrinidadian and TobagonianTsimshianTurkishU.S. Virgin IslanderUgandanUkrainianUruguayanUteVenezuelanVietnameseWelshWest IndianYakamaYaquiYugoslavianYumanYup'ikZimbabwean
Immigration
NonimmigrantsImmigrantsAfghanistanAfricaAlbaniaArgentinaArmeniaAsiaAustraliaAustriaBahamasBangladeshBarbadosBelarusBelgiumBelizeBoliviaBosnia and HerzegovinaBrazilBulgariaBurma/MyanmarCabo VerdeCambodiaCameroonCanadaCaribbeanCentral AmericaChileChinaColombiaCongoCosta RicaCroatiaCubaCzechoslovakiaDenmarkDominicaDominican RepublicEastern AfricaEastern AsiaEastern EuropeEcuadorEgyptEl SalvadorEnglandEritreaEthiopiaEuropeFijiFranceGermanyGhanaGreeceGrenadaGuatemalaGuyanaHaitiHondurasHong KongHungaryIndiaIndonesiaIranIraqIrelandIsraelItalyJamaicaJapanJordanKazakhstanKenyaKoreaKuwaitLaosLatin AmericaLatviaLebanonLiberiaLithuaniaMalaysiaMexicoMicronesiaMiddle AfricaMoldovaMoroccoNepalNetherlandsNicaraguaNigeriaNorth AmericaNorth MacedoniaNorthern AfricaNorthern EuropeNorwayOceaniaPakistanPanamaPeruPhilippinesPolandPortugalRomaniaRussiaSaudi ArabiaScotlandSenegalSerbiaSierra LeoneSingaporeSomaliaSouth AfricaSouth AmericaSouth Central AsiaSouth Eastern AsiaSouthern EuropeSpainSri LankaSt. Vincent and the GrenadinesSudanSwedenSwitzerlandSyriaTaiwanThailandTrinidad and TobagoTurkeyUgandaUkraineUruguayUzbekistanVenezuelaVietnamWestern AfricaWestern AsiaWestern EuropeYemenZaireZimbabweAzores
Self-Care Disability
Income
Poverty
Unemployment
Labor Participation
Family Structure
Vehicle Availability
Education Level
Disability

Immigrants from West Indies Self-Care Disability
Tragic

2.8%
SELF-CARE DISABILITY
0.0/ 100
METRIC RATING
305th/ 347
METRIC RANK

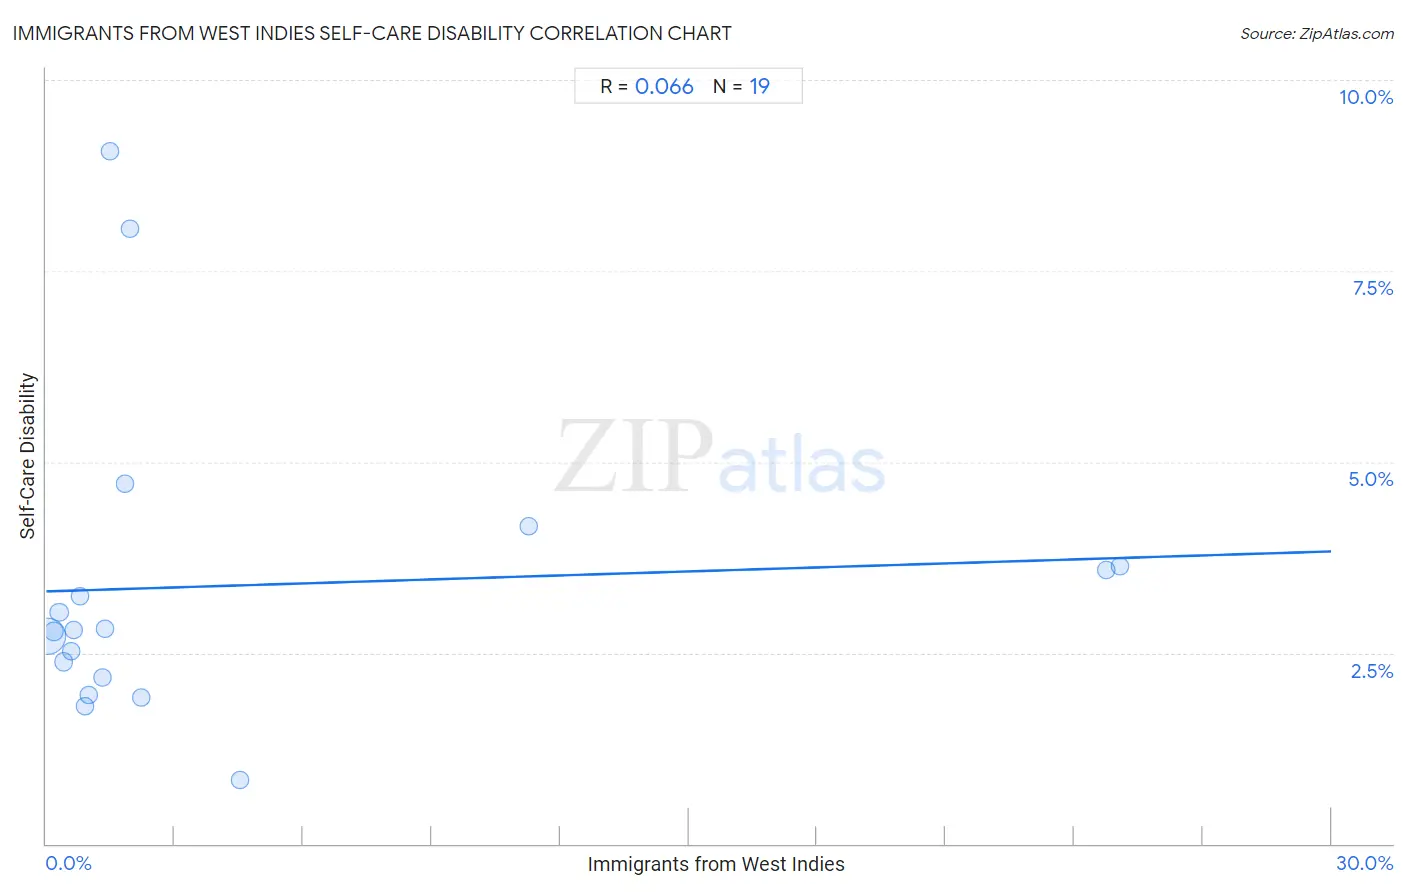
Immigrants from West Indies Self-Care Disability Correlation Chart

The statistical analysis conducted on geographies consisting of 72,451,544 people shows a slight positive correlation between the proportion of Immigrants from West Indies and percentage of population with self-care disability in the United States with a correlation coefficient (R) of 0.066 and weighted average of 2.8%. On average, for every 1% (one percent) increase in Immigrants from West Indies within a typical geography, there is an increase of 0.017% in percentage of population with self-care disability.
Immigrants from West Indies Self-Care Disability
It is essential to understand that the correlation between the percentage of Immigrants from West Indies and percentage of population with self-care disability does not imply a direct cause-and-effect relationship. It remains uncertain whether the presence of Immigrants from West Indies influences an upward or downward trend in the level of percentage of population with self-care disability within an area, or if Immigrants from West Indies simply ended up residing in those areas with higher or lower levels of percentage of population with self-care disability due to other factors.

Demographics Similar to Immigrants from West Indies by Self-Care Disability

In terms of self-care disability, the demographic groups most similar to Immigrants from West Indies are Cree (2.8%, a difference of 0.050%), Immigrants from Belize (2.8%, a difference of 0.20%), Immigrants from St. Vincent and the Grenadines (2.8%, a difference of 0.35%), Pima (2.8%, a difference of 0.39%), and Aleut (2.8%, a difference of 0.40%).
DemographicsRating | RankSelf-Care Disability
Americans
0.0
/100
|
#298
Tragic
2.8%
Immigrants from Guyana
0.0
/100
|
#299
Tragic
2.8%
Immigrants from Fiji
0.0
/100
|
#300
Tragic
2.8%
Pima
0.0
/100
|
#301
Tragic
2.8%
Immigrants from St. Vincent and the Grenadines
0.0
/100
|
#302
Tragic
2.8%
Immigrants from Belize
0.0
/100
|
#303
Tragic
2.8%
Cree
0.0
/100
|
#304
Tragic
2.8%
Immigrants from West Indies
0.0
/100
|
#305
Tragic
2.8%
Aleuts
0.0
/100
|
#306
Tragic
2.8%
Natives/Alaskans
0.0
/100
|
#307
Tragic
2.8%
Immigrants from Grenada
0.0
/100
|
#308
Tragic
2.8%
Bangladeshis
0.0
/100
|
#309
Tragic
2.8%
British West Indians
0.0
/100
|
#310
Tragic
2.8%
Puget Sound Salish
0.0
/100
|
#311
Tragic
2.8%
Immigrants from Caribbean
0.0
/100
|
#312
Tragic
2.8%

Immigrants from West Indies Self-Care Disability Correlation Summary

MeasurementImmigrants from West Indies DataSelf-Care Disability Data
Minimum0.030%0.84%
Maximum25.1%9.1%
Range25.0%8.2%
Mean4.2%3.4%
Median1.3%2.8%
Interquartile 25% (IQ1)0.59%2.2%
Interquartile 75% (IQ3)2.2%3.6%
Interquartile Range (IQR)1.6%1.4%
Standard Deviation (Sample)7.7%2.0%
Standard Deviation (Population)7.5%2.0%

Correlation Details

Immigrants from West Indies PercentileSample SizeSelf-Care Disability
[
0.0%
-
0.5%
]
0.030%
66,225,9912.7%
[
0.0%
-
0.5%
]
0.17%
3,580,4052.8%
[
0.0%
-
0.5%
]
0.30%
1,428,0833.0%
[
0.0%
-
0.5%
]
0.42%
550,8082.4%
[
0.5%
-
1.0%
]
0.59%
333,6192.5%
[
0.5%
-
1.0%
]
0.64%
116,2882.8%
[
0.5%
-
1.0%
]
0.80%
10,2393.2%
[
0.5%
-
1.0%
]
0.91%
37,0371.8%
[
0.5%
-
1.0%
]
0.99%
20,0782.0%
[
1.0%
-
1.5%
]
1.31%
104,5072.2%
[
1.0%
-
1.5%
]
1.38%
10,3352.8%
[
1.0%
-
1.5%
]
1.50%
16,8089.1%
[
1.5%
-
2.0%
]
1.84%
2,1724.7%
[
1.5%
-
2.0%
]
1.95%
9,9838.1%
[
2.0%
-
2.5%
]
2.23%
5391.9%
[
4.5%
-
5.0%
]
4.53%
7730.84%
[
11.0%
-
11.5%
]
11.28%
3374.2%
[
24.5%
-
25.0%
]
24.75%
1,7823.6%
[
25.0%
-
25.5%
]
25.06%
1,7603.6%