Scotch-Irish Disability Age Under 5
COMPARE
Scotch-Irish
Select to Compare
Disability Age Under 5
Scotch-Irish Disability Age Under 5
1.7%
DISABILITY | AGE UNDER 5
0.0/ 100
METRIC RATING
320th/ 347
METRIC RANK
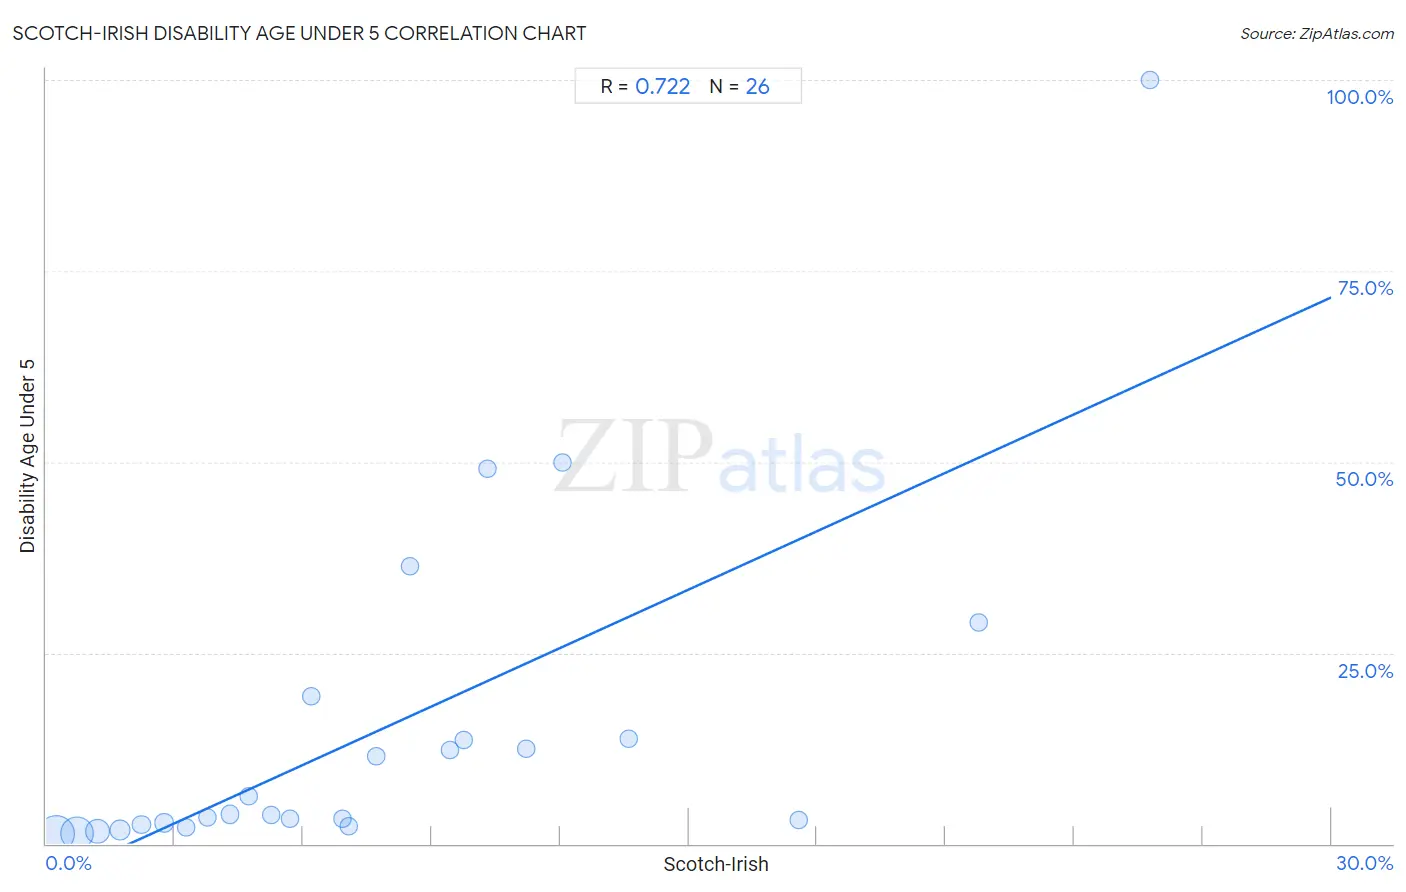
Scotch-Irish Disability Age Under 5 Correlation Chart
The statistical analysis conducted on geographies consisting of 253,637,747 people shows a strong positive correlation between the proportion of Scotch-Irish and percentage of population with a disability under the age of 5 in the United States with a correlation coefficient (R) of 0.722 and weighted average of 1.7%. On average, for every 1% (one percent) increase in Scotch-Irish within a typical geography, there is an increase of 2.5% in percentage of population with a disability under the age of 5.
It is essential to understand that the correlation between the percentage of Scotch-Irish and percentage of population with a disability under the age of 5 does not imply a direct cause-and-effect relationship. It remains uncertain whether the presence of Scotch-Irish influences an upward or downward trend in the level of percentage of population with a disability under the age of 5 within an area, or if Scotch-Irish simply ended up residing in those areas with higher or lower levels of percentage of population with a disability under the age of 5 due to other factors.
Demographics Similar to Scotch-Irish by Disability Age Under 5
In terms of disability age under 5, the demographic groups most similar to Scotch-Irish are Ottawa (1.7%, a difference of 0.060%), Slovak (1.7%, a difference of 0.53%), German (1.7%, a difference of 0.63%), Irish (1.7%, a difference of 0.84%), and French (1.7%, a difference of 1.1%).
| Demographics | Rating | Rank | Disability Age Under 5 |
| Celtics | 0.0 /100 | #313 | Tragic 1.7% |
| Norwegians | 0.0 /100 | #314 | Tragic 1.7% |
| Dutch | 0.0 /100 | #315 | Tragic 1.7% |
| Immigrants from Cabo Verde | 0.0 /100 | #316 | Tragic 1.7% |
| French | 0.0 /100 | #317 | Tragic 1.7% |
| Irish | 0.0 /100 | #318 | Tragic 1.7% |
| Slovaks | 0.0 /100 | #319 | Tragic 1.7% |
| Scotch-Irish | 0.0 /100 | #320 | Tragic 1.7% |
| Ottawa | 0.0 /100 | #321 | Tragic 1.7% |
| Germans | 0.0 /100 | #322 | Tragic 1.7% |
| Chickasaw | 0.0 /100 | #323 | Tragic 1.7% |
| Cherokee | 0.0 /100 | #324 | Tragic 1.8% |
| Immigrants from Portugal | 0.0 /100 | #325 | Tragic 1.8% |
| Sioux | 0.0 /100 | #326 | Tragic 1.8% |
| Osage | 0.0 /100 | #327 | Tragic 1.8% |
Scotch-Irish Disability Age Under 5 Correlation Summary
| Measurement | Scotch-Irish Data | Disability Age Under 5 Data |
| Minimum | 0.25% | 1.3% |
| Maximum | 25.8% | 100.0% |
| Range | 25.5% | 98.7% |
| Mean | 7.8% | 15.0% |
| Median | 6.5% | 3.8% |
| Interquartile 25% (IQ1) | 3.3% | 2.5% |
| Interquartile 75% (IQ3) | 10.3% | 13.7% |
| Interquartile Range (IQR) | 7.0% | 11.1% |
| Standard Deviation (Sample) | 6.3% | 22.4% |
| Standard Deviation (Population) | 6.2% | 22.0% |
Correlation Details
| Scotch-Irish Percentile | Sample Size | Disability Age Under 5 |
[ 0.0% - 0.5% ] 0.25% | 105,706,390 | 1.3% |
[ 0.5% - 1.0% ] 0.72% | 90,030,739 | 1.4% |
[ 1.0% - 1.5% ] 1.20% | 34,398,211 | 1.6% |
[ 1.5% - 2.0% ] 1.71% | 13,573,608 | 1.8% |
[ 2.0% - 2.5% ] 2.22% | 4,920,548 | 2.5% |
[ 2.5% - 3.0% ] 2.75% | 2,576,917 | 2.7% |
[ 3.0% - 3.5% ] 3.26% | 1,291,107 | 2.2% |
[ 3.5% - 4.0% ] 3.77% | 490,288 | 3.5% |
[ 4.0% - 4.5% ] 4.28% | 215,225 | 3.8% |
[ 4.5% - 5.0% ] 4.73% | 81,197 | 6.3% |
[ 5.0% - 5.5% ] 5.24% | 228,893 | 3.8% |
[ 5.5% - 6.0% ] 5.70% | 64,485 | 3.3% |
[ 6.0% - 6.5% ] 6.19% | 7,484 | 19.3% |
[ 6.5% - 7.0% ] 6.91% | 13,034 | 3.3% |
[ 7.0% - 7.5% ] 7.07% | 20,079 | 2.3% |
[ 7.5% - 8.0% ] 7.71% | 1,984 | 11.5% |
[ 8.0% - 8.5% ] 8.50% | 871 | 36.4% |
[ 9.0% - 9.5% ] 9.44% | 1,197 | 12.4% |
[ 9.5% - 10.0% ] 9.74% | 6,908 | 13.6% |
[ 10.0% - 10.5% ] 10.30% | 981 | 49.1% |
[ 11.0% - 11.5% ] 11.22% | 205 | 12.5% |
[ 12.0% - 12.5% ] 12.06% | 340 | 50.0% |
[ 13.5% - 14.0% ] 13.61% | 1,580 | 13.7% |
[ 17.5% - 18.0% ] 17.56% | 4,573 | 3.1% |
[ 21.5% - 22.0% ] 21.76% | 740 | 29.0% |
[ 25.5% - 26.0% ] 25.77% | 163 | 100.0% |