Immigrants from Austria Self-Care Disability

COMPARE

Immigrants from Austria
Race
Ancestry
AfghanAfricanAlaska NativeAlaskan AthabascanAlbanianAleutAlsatianAmericanApacheArabArapahoArgentineanArmenianAssyrian/Chaldean/SyriacAustralianAustrianBahamianBangladeshiBarbadianBasqueBelgianBelizeanBermudanBhutaneseBlackfeetBolivianBrazilianBritishBritish West IndianBulgarianBurmeseCajunCambodianCanadianCape VerdeanCarpatho RusynCelticCentral AmericanCentral American IndianCherokeeCheyenneChickasawChileanChineseChippewaChoctawColombianColvilleComancheCosta RicanCreeCreekCroatianCrowCubanCypriotCzechCzechoslovakianDanishDelawareDominicanDutchDutch West IndianEastern EuropeanEcuadorianEgyptianEnglishEstonianEthiopianEuropeanFijianFilipinoFinnishFrenchFrench American IndianFrench CanadianGermanGerman RussianGhanaianGreekGuamanian/ChamorroGuatemalanGuyaneseHaitianHmongHonduranHopiHoumaHungarianIcelanderIndian (Asian)IndonesianInupiatIranianIraqiIrishIroquoisIsraeliItalianJamaicanJapaneseJordanianKenyanKiowaKoreanLaotianLatvianLebaneseLiberianLithuanianLumbeeLuxembourgerMacedonianMalaysianMalteseMarshalleseMenomineeMexicanMexican American IndianMongolianMoroccanNative HawaiianNavajoNepaleseNew ZealanderNicaraguanNigerianNorthern EuropeanNorwegianOkinawanOsageOttawaPaiutePakistaniPalestinianPanamanianParaguayanPennsylvania GermanPeruvianPimaPolishPortuguesePotawatomiPuebloPuerto RicanPuget Sound SalishRomanianRussianSalvadoranSamoanScandinavianScotch-IrishScottishSeminoleSenegaleseSerbianShoshoneSierra LeoneanSiouxSlavicSlovakSloveneSomaliSouth AfricanSouth AmericanSouth American IndianSoviet UnionSpaniardSpanishSpanish AmericanSpanish American IndianSri LankanSubsaharan AfricanSudaneseSwedishSwissSyrianTaiwaneseThaiTlingit-HaidaTohono O'OdhamTonganTrinidadian and TobagonianTsimshianTurkishU.S. Virgin IslanderUgandanUkrainianUruguayanUteVenezuelanVietnameseWelshWest IndianYakamaYaquiYugoslavianYumanYup'ikZimbabwean
Immigration
NonimmigrantsImmigrantsAfghanistanAfricaAlbaniaArgentinaArmeniaAsiaAustraliaAustriaBahamasBangladeshBarbadosBelarusBelgiumBelizeBoliviaBosnia and HerzegovinaBrazilBulgariaBurma/MyanmarCabo VerdeCambodiaCameroonCanadaCaribbeanCentral AmericaChileChinaColombiaCongoCosta RicaCroatiaCubaCzechoslovakiaDenmarkDominicaDominican RepublicEastern AfricaEastern AsiaEastern EuropeEcuadorEgyptEl SalvadorEnglandEritreaEthiopiaEuropeFijiFranceGermanyGhanaGreeceGrenadaGuatemalaGuyanaHaitiHondurasHong KongHungaryIndiaIndonesiaIranIraqIrelandIsraelItalyJamaicaJapanJordanKazakhstanKenyaKoreaKuwaitLaosLatin AmericaLatviaLebanonLiberiaLithuaniaMalaysiaMexicoMicronesiaMiddle AfricaMoldovaMoroccoNepalNetherlandsNicaraguaNigeriaNorth AmericaNorth MacedoniaNorthern AfricaNorthern EuropeNorwayOceaniaPakistanPanamaPeruPhilippinesPolandPortugalRomaniaRussiaSaudi ArabiaScotlandSenegalSerbiaSierra LeoneSingaporeSomaliaSouth AfricaSouth AmericaSouth Central AsiaSouth Eastern AsiaSouthern EuropeSpainSri LankaSt. Vincent and the GrenadinesSudanSwedenSwitzerlandSyriaTaiwanThailandTrinidad and TobagoTurkeyUgandaUkraineUruguayUzbekistanVenezuelaVietnamWest IndiesWestern AfricaWestern AsiaWestern EuropeYemenZaireZimbabweAzores
Select to Compare
Race
Ancestry
AfghanAfricanAlaska NativeAlaskan AthabascanAlbanianAleutAlsatianAmericanApacheArabArapahoArgentineanArmenianAssyrian/Chaldean/SyriacAustralianAustrianBahamianBangladeshiBarbadianBasqueBelgianBelizeanBermudanBhutaneseBlackfeetBolivianBrazilianBritishBritish West IndianBulgarianBurmeseCajunCambodianCanadianCape VerdeanCarpatho RusynCelticCentral AmericanCentral American IndianCherokeeCheyenneChickasawChileanChineseChippewaChoctawColombianColvilleComancheCosta RicanCreeCreekCroatianCrowCubanCypriotCzechCzechoslovakianDanishDelawareDominicanDutchDutch West IndianEastern EuropeanEcuadorianEgyptianEnglishEstonianEthiopianEuropeanFijianFilipinoFinnishFrenchFrench American IndianFrench CanadianGermanGerman RussianGhanaianGreekGuamanian/ChamorroGuatemalanGuyaneseHaitianHmongHonduranHopiHoumaHungarianIcelanderIndian (Asian)IndonesianInupiatIranianIraqiIrishIroquoisIsraeliItalianJamaicanJapaneseJordanianKenyanKiowaKoreanLaotianLatvianLebaneseLiberianLithuanianLumbeeLuxembourgerMacedonianMalaysianMalteseMarshalleseMenomineeMexicanMexican American IndianMongolianMoroccanNative HawaiianNavajoNepaleseNew ZealanderNicaraguanNigerianNorthern EuropeanNorwegianOkinawanOsageOttawaPaiutePakistaniPalestinianPanamanianParaguayanPennsylvania GermanPeruvianPimaPolishPortuguesePotawatomiPuebloPuerto RicanPuget Sound SalishRomanianRussianSalvadoranSamoanScandinavianScotch-IrishScottishSeminoleSenegaleseSerbianShoshoneSierra LeoneanSiouxSlavicSlovakSloveneSomaliSouth AfricanSouth AmericanSouth American IndianSoviet UnionSpaniardSpanishSpanish AmericanSpanish American IndianSri LankanSubsaharan AfricanSudaneseSwedishSwissSyrianTaiwaneseThaiTlingit-HaidaTohono O'OdhamTonganTrinidadian and TobagonianTsimshianTurkishU.S. Virgin IslanderUgandanUkrainianUruguayanUteVenezuelanVietnameseWelshWest IndianYakamaYaquiYugoslavianYumanYup'ikZimbabwean
Immigration
NonimmigrantsImmigrantsAfghanistanAfricaAlbaniaArgentinaArmeniaAsiaAustraliaBahamasBangladeshBarbadosBelarusBelgiumBelizeBoliviaBosnia and HerzegovinaBrazilBulgariaBurma/MyanmarCabo VerdeCambodiaCameroonCanadaCaribbeanCentral AmericaChileChinaColombiaCongoCosta RicaCroatiaCubaCzechoslovakiaDenmarkDominicaDominican RepublicEastern AfricaEastern AsiaEastern EuropeEcuadorEgyptEl SalvadorEnglandEritreaEthiopiaEuropeFijiFranceGermanyGhanaGreeceGrenadaGuatemalaGuyanaHaitiHondurasHong KongHungaryIndiaIndonesiaIranIraqIrelandIsraelItalyJamaicaJapanJordanKazakhstanKenyaKoreaKuwaitLaosLatin AmericaLatviaLebanonLiberiaLithuaniaMalaysiaMexicoMicronesiaMiddle AfricaMoldovaMoroccoNepalNetherlandsNicaraguaNigeriaNorth AmericaNorth MacedoniaNorthern AfricaNorthern EuropeNorwayOceaniaPakistanPanamaPeruPhilippinesPolandPortugalRomaniaRussiaSaudi ArabiaScotlandSenegalSerbiaSierra LeoneSingaporeSomaliaSouth AfricaSouth AmericaSouth Central AsiaSouth Eastern AsiaSouthern EuropeSpainSri LankaSt. Vincent and the GrenadinesSudanSwedenSwitzerlandSyriaTaiwanThailandTrinidad and TobagoTurkeyUgandaUkraineUruguayUzbekistanVenezuelaVietnamWest IndiesWestern AfricaWestern AsiaWestern EuropeYemenZaireZimbabweAzores
Self-Care Disability
Income
Poverty
Unemployment
Labor Participation
Family Structure
Vehicle Availability
Education Level
Disability

Immigrants from Austria Self-Care Disability
Excellent

2.4%
SELF-CARE DISABILITY
89.0/ 100
METRIC RATING
130th/ 347
METRIC RANK

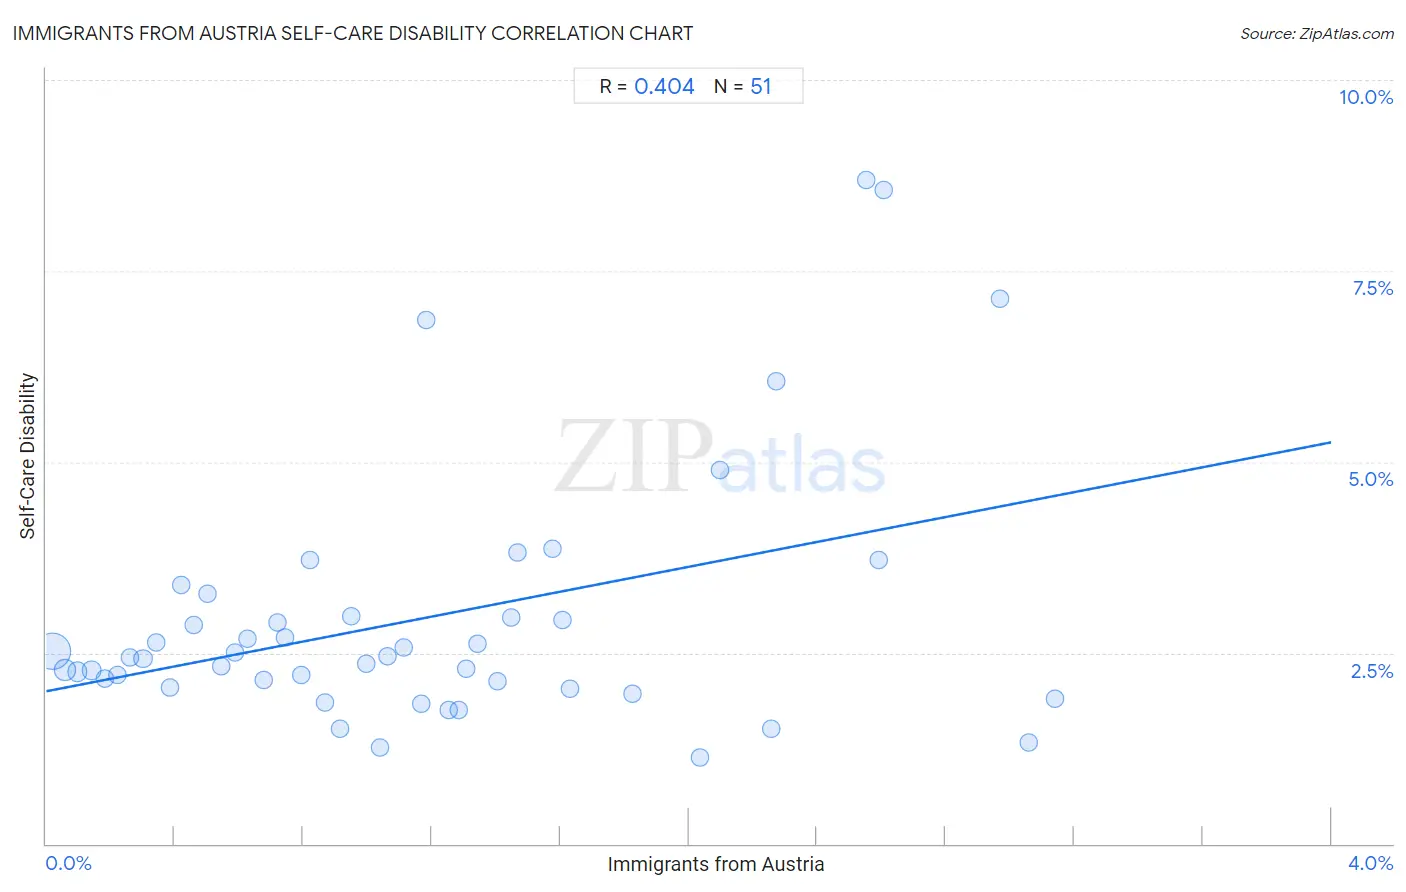
Immigrants from Austria Self-Care Disability Correlation Chart

The statistical analysis conducted on geographies consisting of 167,909,652 people shows a moderate positive correlation between the proportion of Immigrants from Austria and percentage of population with self-care disability in the United States with a correlation coefficient (R) of 0.404 and weighted average of 2.4%. On average, for every 1% (one percent) increase in Immigrants from Austria within a typical geography, there is an increase of 0.81% in percentage of population with self-care disability.
Immigrants from Austria Self-Care Disability
It is essential to understand that the correlation between the percentage of Immigrants from Austria and percentage of population with self-care disability does not imply a direct cause-and-effect relationship. It remains uncertain whether the presence of Immigrants from Austria influences an upward or downward trend in the level of percentage of population with self-care disability within an area, or if Immigrants from Austria simply ended up residing in those areas with higher or lower levels of percentage of population with self-care disability due to other factors.

Demographics Similar to Immigrants from Austria by Self-Care Disability

In terms of self-care disability, the demographic groups most similar to Immigrants from Austria are Polish (2.4%, a difference of 0.020%), Immigrants from Romania (2.4%, a difference of 0.030%), Immigrants from South America (2.4%, a difference of 0.030%), Immigrants from Colombia (2.4%, a difference of 0.060%), and Colombian (2.4%, a difference of 0.080%).
DemographicsRating | RankSelf-Care Disability
Immigrants from Nigeria
90.3
/100
|
#123
Exceptional
2.4%
Immigrants from Morocco
90.2
/100
|
#124
Exceptional
2.4%
Immigrants from North America
90.2
/100
|
#124
Exceptional
2.4%
Hmong
89.9
/100
|
#126
Excellent
2.4%
Colombians
89.7
/100
|
#127
Excellent
2.4%
Immigrants from Hungary
89.6
/100
|
#128
Excellent
2.4%
Immigrants from Romania
89.3
/100
|
#129
Excellent
2.4%
Immigrants from Austria
89.0
/100
|
#130
Excellent
2.4%
Poles
88.9
/100
|
#131
Excellent
2.4%
Immigrants from South America
88.8
/100
|
#132
Excellent
2.4%
Immigrants from Colombia
88.5
/100
|
#133
Excellent
2.4%
Russians
88.2
/100
|
#134
Excellent
2.4%
Laotians
87.8
/100
|
#135
Excellent
2.4%
South American Indians
87.2
/100
|
#136
Excellent
2.4%
Austrians
87.0
/100
|
#137
Excellent
2.4%

Immigrants from Austria Self-Care Disability Correlation Summary

MeasurementImmigrants from Austria DataSelf-Care Disability Data
Minimum0.018%1.1%
Maximum3.1%8.7%
Range3.1%7.6%
Mean1.2%3.0%
Median1.0%2.4%
Interquartile 25% (IQ1)0.50%2.0%
Interquartile 75% (IQ3)1.6%3.0%
Interquartile Range (IQR)1.1%0.94%
Standard Deviation (Sample)0.84%1.7%
Standard Deviation (Population)0.83%1.7%

Correlation Details

Immigrants from Austria PercentileSample SizeSelf-Care Disability
[
0.0%
-
0.5%
]
0.018%
123,327,2032.5%
[
0.0%
-
0.5%
]
0.057%
24,684,7622.3%
[
0.0%
-
0.5%
]
0.097%
10,051,0482.3%
[
0.0%
-
0.5%
]
0.14%
3,678,3922.3%
[
0.0%
-
0.5%
]
0.18%
2,164,4902.2%
[
0.0%
-
0.5%
]
0.22%
954,4702.2%
[
0.0%
-
0.5%
]
0.26%
823,7052.4%
[
0.0%
-
0.5%
]
0.30%
561,1512.4%
[
0.0%
-
0.5%
]
0.34%
351,5302.6%
[
0.0%
-
0.5%
]
0.39%
227,8522.0%
[
0.0%
-
0.5%
]
0.42%
260,4443.4%
[
0.0%
-
0.5%
]
0.46%
146,8312.9%
[
0.5%
-
1.0%
]
0.50%
87,0623.3%
[
0.5%
-
1.0%
]
0.55%
91,9122.3%
[
0.5%
-
1.0%
]
0.59%
58,4342.5%
[
0.5%
-
1.0%
]
0.63%
52,8142.7%
[
0.5%
-
1.0%
]
0.68%
53,8312.1%
[
0.5%
-
1.0%
]
0.72%
76,6932.9%
[
0.5%
-
1.0%
]
0.74%
7,8032.7%
[
0.5%
-
1.0%
]
0.79%
10,4642.2%
[
0.5%
-
1.0%
]
0.82%
17,0723.7%
[
0.5%
-
1.0%
]
0.87%
59,6941.8%
[
0.5%
-
1.0%
]
0.92%
12,8781.5%
[
0.5%
-
1.0%
]
0.95%
13,7723.0%
[
0.5%
-
1.0%
]
1.00%
15,8402.4%
[
1.0%
-
1.5%
]
1.04%
6,4451.3%
[
1.0%
-
1.5%
]
1.06%
30,3702.5%
[
1.0%
-
1.5%
]
1.11%
5,7442.6%
[
1.0%
-
1.5%
]
1.17%
1,8021.8%
[
1.0%
-
1.5%
]
1.18%
3,5516.9%
[
1.0%
-
1.5%
]
1.25%
1,5981.8%
[
1.0%
-
1.5%
]
1.28%
12,6171.7%
[
1.0%
-
1.5%
]
1.31%
3,4412.3%
[
1.0%
-
1.5%
]
1.34%
7462.6%
[
1.0%
-
1.5%
]
1.40%
4,2042.1%
[
1.0%
-
1.5%
]
1.45%
4,5553.0%
[
1.0%
-
1.5%
]
1.47%
16,0263.8%
[
1.5%
-
2.0%
]
1.58%
4,3153.9%
[
1.5%
-
2.0%
]
1.61%
2,8632.9%
[
1.5%
-
2.0%
]
1.63%
1,5332.0%
[
1.5%
-
2.0%
]
1.82%
3292.0%
[
2.0%
-
2.5%
]
2.04%
1,3751.1%
[
2.0%
-
2.5%
]
2.10%
1434.9%
[
2.0%
-
2.5%
]
2.26%
1331.5%
[
2.0%
-
2.5%
]
2.27%
3,3446.1%
[
2.5%
-
3.0%
]
2.55%
1,6858.7%
[
2.5%
-
3.0%
]
2.59%
5,4063.7%
[
2.5%
-
3.0%
]
2.61%
5378.6%
[
2.5%
-
3.0%
]
2.97%
1017.1%
[
3.0%
-
3.5%
]
3.06%
4,3181.3%
[
3.0%
-
3.5%
]
3.14%
2,3241.9%