Immigrants from Uzbekistan Self-Care Disability
COMPARE
Immigrants from Uzbekistan
Select to Compare
Self-Care Disability
Immigrants from Uzbekistan Self-Care Disability
2.9%
SELF-CARE DISABILITY
0.0/ 100
METRIC RATING
325th/ 347
METRIC RANK
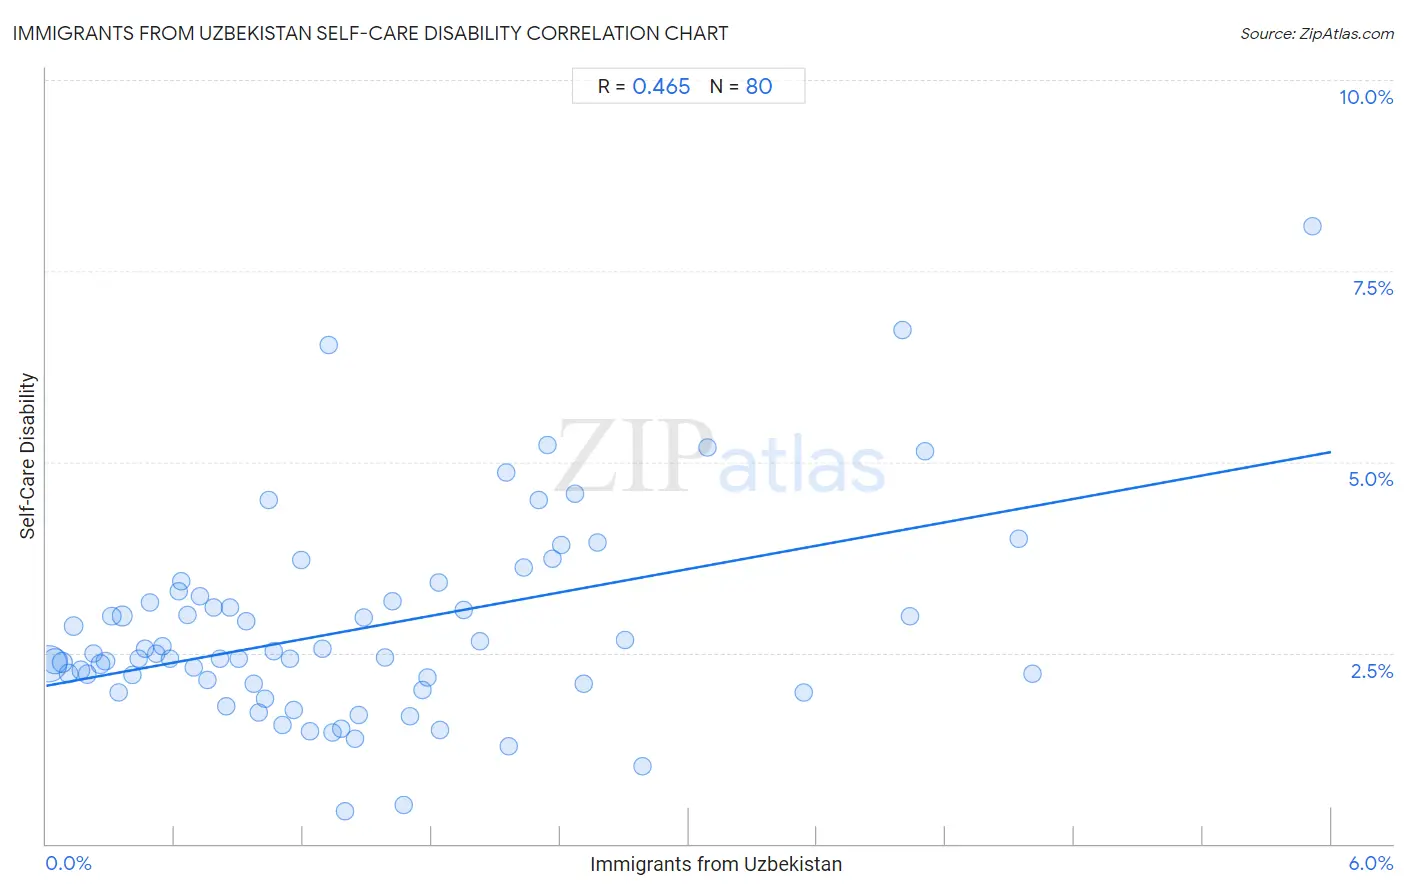
Immigrants from Uzbekistan Self-Care Disability Correlation Chart
The statistical analysis conducted on geographies consisting of 118,703,600 people shows a moderate positive correlation between the proportion of Immigrants from Uzbekistan and percentage of population with self-care disability in the United States with a correlation coefficient (R) of 0.465 and weighted average of 2.9%. On average, for every 1% (one percent) increase in Immigrants from Uzbekistan within a typical geography, there is an increase of 0.51% in percentage of population with self-care disability.
It is essential to understand that the correlation between the percentage of Immigrants from Uzbekistan and percentage of population with self-care disability does not imply a direct cause-and-effect relationship. It remains uncertain whether the presence of Immigrants from Uzbekistan influences an upward or downward trend in the level of percentage of population with self-care disability within an area, or if Immigrants from Uzbekistan simply ended up residing in those areas with higher or lower levels of percentage of population with self-care disability due to other factors.
Demographics Similar to Immigrants from Uzbekistan by Self-Care Disability
In terms of self-care disability, the demographic groups most similar to Immigrants from Uzbekistan are Cherokee (2.9%, a difference of 0.53%), Seminole (2.9%, a difference of 0.63%), Comanche (2.9%, a difference of 0.75%), Paiute (2.9%, a difference of 0.94%), and Black/African American (2.9%, a difference of 1.0%).
| Demographics | Rating | Rank | Self-Care Disability |
| Assyrians/Chaldeans/Syriacs | 0.0 /100 | #318 | Tragic 2.8% |
| Spanish American Indians | 0.0 /100 | #319 | Tragic 2.9% |
| Chickasaw | 0.0 /100 | #320 | Tragic 2.9% |
| Navajo | 0.0 /100 | #321 | Tragic 2.9% |
| Comanche | 0.0 /100 | #322 | Tragic 2.9% |
| Seminole | 0.0 /100 | #323 | Tragic 2.9% |
| Cherokee | 0.0 /100 | #324 | Tragic 2.9% |
| Immigrants from Uzbekistan | 0.0 /100 | #325 | Tragic 2.9% |
| Paiute | 0.0 /100 | #326 | Tragic 2.9% |
| Blacks/African Americans | 0.0 /100 | #327 | Tragic 2.9% |
| Hopi | 0.0 /100 | #328 | Tragic 2.9% |
| Cajuns | 0.0 /100 | #329 | Tragic 2.9% |
| Nepalese | 0.0 /100 | #330 | Tragic 3.0% |
| Lumbee | 0.0 /100 | #331 | Tragic 3.0% |
| Kiowa | 0.0 /100 | #332 | Tragic 3.0% |
Immigrants from Uzbekistan Self-Care Disability Correlation Summary
| Measurement | Immigrants from Uzbekistan Data | Self-Care Disability Data |
| Minimum | 0.011% | 0.43% |
| Maximum | 5.9% | 8.1% |
| Range | 5.9% | 7.6% |
| Mean | 1.5% | 2.8% |
| Median | 1.2% | 2.5% |
| Interquartile 25% (IQ1) | 0.60% | 2.1% |
| Interquartile 75% (IQ3) | 2.1% | 3.2% |
| Interquartile Range (IQR) | 1.5% | 1.1% |
| Standard Deviation (Sample) | 1.2% | 1.3% |
| Standard Deviation (Population) | 1.2% | 1.3% |
Correlation Details
| Immigrants from Uzbekistan Percentile | Sample Size | Self-Care Disability |
[ 0.0% - 0.5% ] 0.011% | 55,989,810 | 2.4% |
[ 0.0% - 0.5% ] 0.040% | 22,615,047 | 2.4% |
[ 0.0% - 0.5% ] 0.074% | 8,358,369 | 2.4% |
[ 0.0% - 0.5% ] 0.10% | 4,891,774 | 2.2% |
[ 0.0% - 0.5% ] 0.13% | 4,627,317 | 2.8% |
[ 0.0% - 0.5% ] 0.16% | 2,388,485 | 2.3% |
[ 0.0% - 0.5% ] 0.19% | 1,439,084 | 2.2% |
[ 0.0% - 0.5% ] 0.22% | 1,442,507 | 2.5% |
[ 0.0% - 0.5% ] 0.25% | 1,263,971 | 2.4% |
[ 0.0% - 0.5% ] 0.28% | 901,897 | 2.4% |
[ 0.0% - 0.5% ] 0.31% | 425,857 | 3.0% |
[ 0.0% - 0.5% ] 0.34% | 518,173 | 2.0% |
[ 0.0% - 0.5% ] 0.36% | 9,002,227 | 3.0% |
[ 0.0% - 0.5% ] 0.40% | 363,976 | 2.2% |
[ 0.0% - 0.5% ] 0.43% | 363,231 | 2.4% |
[ 0.0% - 0.5% ] 0.46% | 338,944 | 2.6% |
[ 0.0% - 0.5% ] 0.48% | 279,926 | 3.2% |
[ 0.5% - 1.0% ] 0.51% | 216,747 | 2.5% |
[ 0.5% - 1.0% ] 0.54% | 111,316 | 2.6% |
[ 0.5% - 1.0% ] 0.58% | 220,161 | 2.4% |
[ 0.5% - 1.0% ] 0.62% | 31,481 | 3.3% |
[ 0.5% - 1.0% ] 0.63% | 99,719 | 3.4% |
[ 0.5% - 1.0% ] 0.66% | 140,451 | 3.0% |
[ 0.5% - 1.0% ] 0.69% | 112,905 | 2.3% |
[ 0.5% - 1.0% ] 0.72% | 96,218 | 3.2% |
[ 0.5% - 1.0% ] 0.75% | 254,139 | 2.1% |
[ 0.5% - 1.0% ] 0.78% | 232,772 | 3.1% |
[ 0.5% - 1.0% ] 0.81% | 90,057 | 2.4% |
[ 0.5% - 1.0% ] 0.84% | 56,560 | 1.8% |
[ 0.5% - 1.0% ] 0.86% | 62,412 | 3.1% |
[ 0.5% - 1.0% ] 0.90% | 137,135 | 2.4% |
[ 0.5% - 1.0% ] 0.93% | 92,335 | 2.9% |
[ 0.5% - 1.0% ] 0.97% | 102,693 | 2.1% |
[ 0.5% - 1.0% ] 0.99% | 82,538 | 1.7% |
[ 1.0% - 1.5% ] 1.02% | 51,127 | 1.9% |
[ 1.0% - 1.5% ] 1.04% | 1,350 | 4.5% |
[ 1.0% - 1.5% ] 1.06% | 23,946 | 2.5% |
[ 1.0% - 1.5% ] 1.10% | 40,746 | 1.5% |
[ 1.0% - 1.5% ] 1.14% | 82,462 | 2.4% |
[ 1.0% - 1.5% ] 1.15% | 4,851 | 1.8% |
[ 1.0% - 1.5% ] 1.19% | 61,086 | 3.7% |
[ 1.0% - 1.5% ] 1.23% | 5,930 | 1.5% |
[ 1.0% - 1.5% ] 1.29% | 40,208 | 2.6% |
[ 1.0% - 1.5% ] 1.32% | 47,893 | 6.5% |
[ 1.0% - 1.5% ] 1.34% | 6,570 | 1.5% |
[ 1.0% - 1.5% ] 1.38% | 83,109 | 1.5% |
[ 1.0% - 1.5% ] 1.40% | 5,016 | 0.43% |
[ 1.0% - 1.5% ] 1.44% | 15,495 | 1.4% |
[ 1.0% - 1.5% ] 1.46% | 1,232 | 1.7% |
[ 1.0% - 1.5% ] 1.48% | 23,244 | 3.0% |
[ 1.5% - 2.0% ] 1.58% | 7,590 | 2.4% |
[ 1.5% - 2.0% ] 1.62% | 13,472 | 3.2% |
[ 1.5% - 2.0% ] 1.67% | 1,017 | 0.50% |
[ 1.5% - 2.0% ] 1.70% | 43,286 | 1.7% |
[ 1.5% - 2.0% ] 1.76% | 6,766 | 2.0% |
[ 1.5% - 2.0% ] 1.78% | 2,022 | 2.2% |
[ 1.5% - 2.0% ] 1.83% | 6,115 | 3.4% |
[ 1.5% - 2.0% ] 1.84% | 2,992 | 1.5% |
[ 1.5% - 2.0% ] 1.95% | 6,714 | 3.1% |
[ 2.0% - 2.5% ] 2.02% | 80,575 | 2.7% |
[ 2.0% - 2.5% ] 2.15% | 279 | 4.9% |
[ 2.0% - 2.5% ] 2.16% | 509 | 1.3% |
[ 2.0% - 2.5% ] 2.23% | 14,291 | 3.6% |
[ 2.0% - 2.5% ] 2.30% | 8,913 | 4.5% |
[ 2.0% - 2.5% ] 2.34% | 641 | 5.2% |
[ 2.0% - 2.5% ] 2.36% | 81,109 | 3.7% |
[ 2.0% - 2.5% ] 2.40% | 90,796 | 3.9% |
[ 2.0% - 2.5% ] 2.47% | 80,113 | 4.6% |
[ 2.5% - 3.0% ] 2.51% | 1,116 | 2.1% |
[ 2.5% - 3.0% ] 2.57% | 20,127 | 3.9% |
[ 2.5% - 3.0% ] 2.70% | 75,212 | 2.7% |
[ 2.5% - 3.0% ] 2.78% | 40,260 | 1.0% |
[ 3.0% - 3.5% ] 3.08% | 33,648 | 5.2% |
[ 3.5% - 4.0% ] 3.54% | 3,136 | 2.0% |
[ 4.0% - 4.5% ] 4.00% | 83,069 | 6.7% |
[ 4.0% - 4.5% ] 4.03% | 1,289 | 3.0% |
[ 4.0% - 4.5% ] 4.10% | 90,245 | 5.1% |
[ 4.5% - 5.0% ] 4.54% | 47,230 | 4.0% |
[ 4.5% - 5.0% ] 4.61% | 13,659 | 2.2% |
[ 5.5% - 6.0% ] 5.91% | 2,910 | 8.1% |