Marshallese Self-Care Disability
COMPARE
Marshallese
Select to Compare
Self-Care Disability
Marshallese Self-Care Disability
2.6%
SELF-CARE DISABILITY
1.2/ 100
METRIC RATING
240th/ 347
METRIC RANK
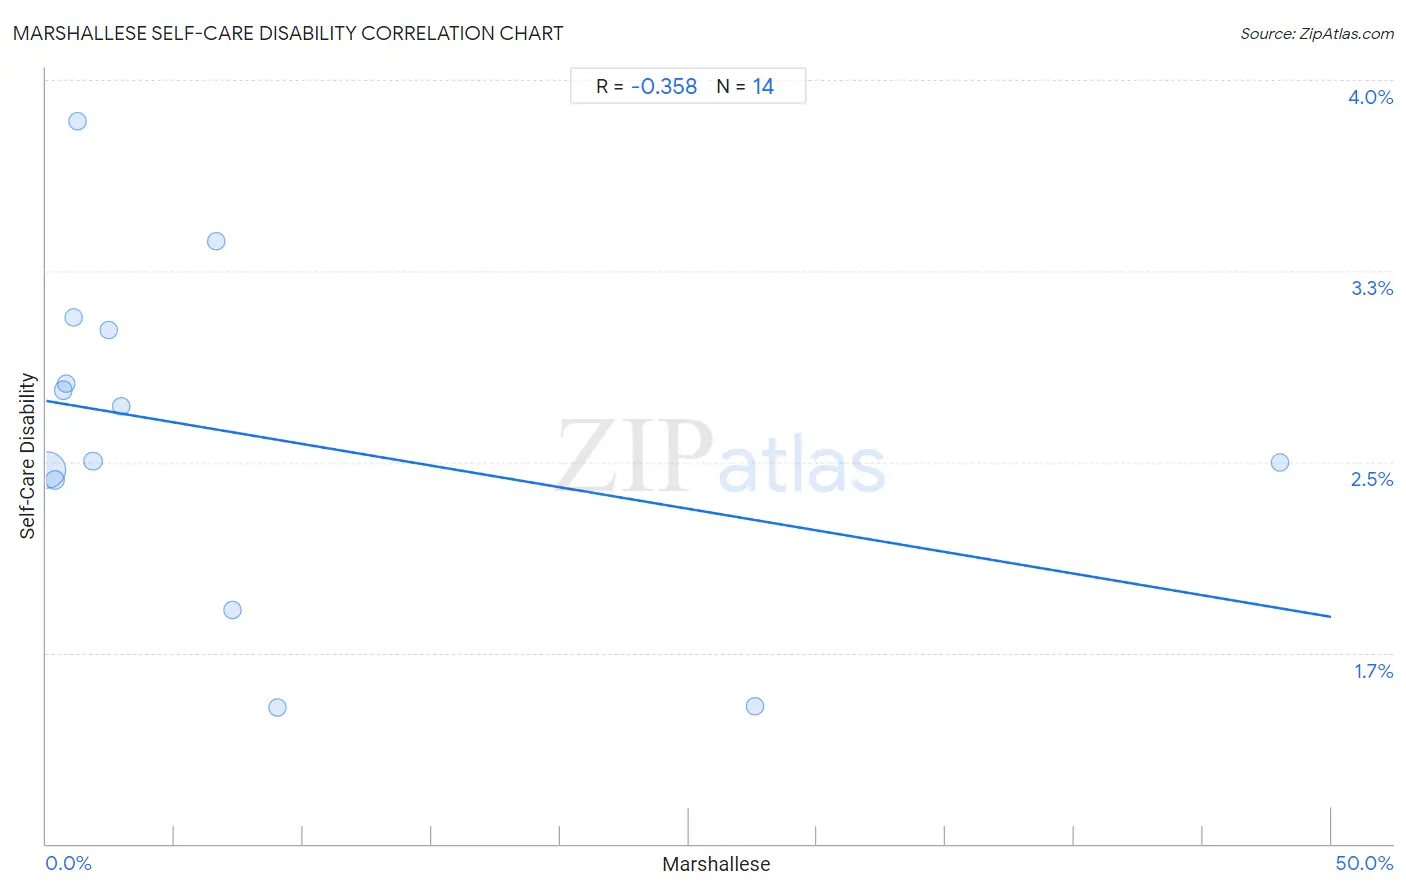
Marshallese Self-Care Disability Correlation Chart
The statistical analysis conducted on geographies consisting of 14,760,594 people shows a mild negative correlation between the proportion of Marshallese and percentage of population with self-care disability in the United States with a correlation coefficient (R) of -0.358 and weighted average of 2.6%. On average, for every 1% (one percent) increase in Marshallese within a typical geography, there is a decrease of 0.017% in percentage of population with self-care disability.
It is essential to understand that the correlation between the percentage of Marshallese and percentage of population with self-care disability does not imply a direct cause-and-effect relationship. It remains uncertain whether the presence of Marshallese influences an upward or downward trend in the level of percentage of population with self-care disability within an area, or if Marshallese simply ended up residing in those areas with higher or lower levels of percentage of population with self-care disability due to other factors.
Demographics Similar to Marshallese by Self-Care Disability
In terms of self-care disability, the demographic groups most similar to Marshallese are Immigrants from Panama (2.6%, a difference of 0.030%), Senegalese (2.6%, a difference of 0.070%), Immigrants from Syria (2.6%, a difference of 0.17%), Immigrants from Senegal (2.6%, a difference of 0.33%), and Spanish (2.6%, a difference of 0.41%).
| Demographics | Rating | Rank | Self-Care Disability |
| Liberians | 2.1 /100 | #233 | Tragic 2.6% |
| Vietnamese | 2.1 /100 | #234 | Tragic 2.6% |
| Bahamians | 2.0 /100 | #235 | Tragic 2.6% |
| Bermudans | 1.9 /100 | #236 | Tragic 2.6% |
| Immigrants from Senegal | 1.6 /100 | #237 | Tragic 2.6% |
| Senegalese | 1.3 /100 | #238 | Tragic 2.6% |
| Immigrants from Panama | 1.2 /100 | #239 | Tragic 2.6% |
| Marshallese | 1.2 /100 | #240 | Tragic 2.6% |
| Immigrants from Syria | 1.0 /100 | #241 | Tragic 2.6% |
| Spanish | 0.8 /100 | #242 | Tragic 2.6% |
| Hawaiians | 0.8 /100 | #243 | Tragic 2.6% |
| Yuman | 0.8 /100 | #244 | Tragic 2.6% |
| Immigrants from Western Asia | 0.6 /100 | #245 | Tragic 2.6% |
| Cheyenne | 0.6 /100 | #246 | Tragic 2.6% |
| Immigrants from Albania | 0.6 /100 | #247 | Tragic 2.6% |
Marshallese Self-Care Disability Correlation Summary
| Measurement | Marshallese Data | Self-Care Disability Data |
| Minimum | 0.037% | 1.5% |
| Maximum | 48.0% | 3.8% |
| Range | 48.0% | 2.3% |
| Mean | 7.8% | 2.6% |
| Median | 2.1% | 2.6% |
| Interquartile 25% (IQ1) | 0.79% | 2.4% |
| Interquartile 75% (IQ3) | 7.2% | 3.0% |
| Interquartile Range (IQR) | 6.5% | 0.59% |
| Standard Deviation (Sample) | 13.6% | 0.64% |
| Standard Deviation (Population) | 13.1% | 0.62% |
Correlation Details
| Marshallese Percentile | Sample Size | Self-Care Disability |
[ 0.0% - 0.5% ] 0.037% | 12,928,307 | 2.5% |
[ 0.0% - 0.5% ] 0.34% | 859,705 | 2.4% |
[ 0.5% - 1.0% ] 0.66% | 591,328 | 2.8% |
[ 0.5% - 1.0% ] 0.79% | 133,430 | 2.8% |
[ 1.0% - 1.5% ] 1.08% | 112,589 | 3.1% |
[ 1.0% - 1.5% ] 1.23% | 2,853 | 3.8% |
[ 1.5% - 2.0% ] 1.82% | 104,259 | 2.5% |
[ 2.0% - 2.5% ] 2.45% | 13,749 | 3.0% |
[ 2.5% - 3.0% ] 2.89% | 2,971 | 2.7% |
[ 6.5% - 7.0% ] 6.61% | 4,827 | 3.4% |
[ 7.0% - 7.5% ] 7.25% | 1,932 | 1.9% |
[ 8.5% - 9.0% ] 8.98% | 3,553 | 1.5% |
[ 27.5% - 28.0% ] 27.56% | 693 | 1.5% |
[ 47.5% - 48.0% ] 47.99% | 398 | 2.5% |