Immigrants from Saudi Arabia Self-Care Disability

COMPARE

Immigrants from Saudi Arabia
Race
Ancestry
AfghanAfricanAlaska NativeAlaskan AthabascanAlbanianAleutAlsatianAmericanApacheArabArapahoArgentineanArmenianAssyrian/Chaldean/SyriacAustralianAustrianBahamianBangladeshiBarbadianBasqueBelgianBelizeanBermudanBhutaneseBlackfeetBolivianBrazilianBritishBritish West IndianBulgarianBurmeseCajunCambodianCanadianCape VerdeanCarpatho RusynCelticCentral AmericanCentral American IndianCherokeeCheyenneChickasawChileanChineseChippewaChoctawColombianColvilleComancheCosta RicanCreeCreekCroatianCrowCubanCypriotCzechCzechoslovakianDanishDelawareDominicanDutchDutch West IndianEastern EuropeanEcuadorianEgyptianEnglishEstonianEthiopianEuropeanFijianFilipinoFinnishFrenchFrench American IndianFrench CanadianGermanGerman RussianGhanaianGreekGuamanian/ChamorroGuatemalanGuyaneseHaitianHmongHonduranHopiHoumaHungarianIcelanderIndian (Asian)IndonesianInupiatIranianIraqiIrishIroquoisIsraeliItalianJamaicanJapaneseJordanianKenyanKiowaKoreanLaotianLatvianLebaneseLiberianLithuanianLumbeeLuxembourgerMacedonianMalaysianMalteseMarshalleseMenomineeMexicanMexican American IndianMongolianMoroccanNative HawaiianNavajoNepaleseNew ZealanderNicaraguanNigerianNorthern EuropeanNorwegianOkinawanOsageOttawaPaiutePakistaniPalestinianPanamanianParaguayanPennsylvania GermanPeruvianPimaPolishPortuguesePotawatomiPuebloPuerto RicanPuget Sound SalishRomanianRussianSalvadoranSamoanScandinavianScotch-IrishScottishSeminoleSenegaleseSerbianShoshoneSierra LeoneanSiouxSlavicSlovakSloveneSomaliSouth AfricanSouth AmericanSouth American IndianSoviet UnionSpaniardSpanishSpanish AmericanSpanish American IndianSri LankanSubsaharan AfricanSudaneseSwedishSwissSyrianTaiwaneseThaiTlingit-HaidaTohono O'OdhamTonganTrinidadian and TobagonianTsimshianTurkishU.S. Virgin IslanderUgandanUkrainianUruguayanUteVenezuelanVietnameseWelshWest IndianYakamaYaquiYugoslavianYumanYup'ikZimbabwean
Immigration
NonimmigrantsImmigrantsAfghanistanAfricaAlbaniaArgentinaArmeniaAsiaAustraliaAustriaBahamasBangladeshBarbadosBelarusBelgiumBelizeBoliviaBosnia and HerzegovinaBrazilBulgariaBurma/MyanmarCabo VerdeCambodiaCameroonCanadaCaribbeanCentral AmericaChileChinaColombiaCongoCosta RicaCroatiaCubaCzechoslovakiaDenmarkDominicaDominican RepublicEastern AfricaEastern AsiaEastern EuropeEcuadorEgyptEl SalvadorEnglandEritreaEthiopiaEuropeFijiFranceGermanyGhanaGreeceGrenadaGuatemalaGuyanaHaitiHondurasHong KongHungaryIndiaIndonesiaIranIraqIrelandIsraelItalyJamaicaJapanJordanKazakhstanKenyaKoreaKuwaitLaosLatin AmericaLatviaLebanonLiberiaLithuaniaMalaysiaMexicoMicronesiaMiddle AfricaMoldovaMoroccoNepalNetherlandsNicaraguaNigeriaNorth AmericaNorth MacedoniaNorthern AfricaNorthern EuropeNorwayOceaniaPakistanPanamaPeruPhilippinesPolandPortugalRomaniaRussiaSaudi ArabiaScotlandSenegalSerbiaSierra LeoneSingaporeSomaliaSouth AfricaSouth AmericaSouth Central AsiaSouth Eastern AsiaSouthern EuropeSpainSri LankaSt. Vincent and the GrenadinesSudanSwedenSwitzerlandSyriaTaiwanThailandTrinidad and TobagoTurkeyUgandaUkraineUruguayUzbekistanVenezuelaVietnamWest IndiesWestern AfricaWestern AsiaWestern EuropeYemenZaireZimbabweAzores
Select to Compare
Race
Ancestry
AfghanAfricanAlaska NativeAlaskan AthabascanAlbanianAleutAlsatianAmericanApacheArabArapahoArgentineanArmenianAssyrian/Chaldean/SyriacAustralianAustrianBahamianBangladeshiBarbadianBasqueBelgianBelizeanBermudanBhutaneseBlackfeetBolivianBrazilianBritishBritish West IndianBulgarianBurmeseCajunCambodianCanadianCape VerdeanCarpatho RusynCelticCentral AmericanCentral American IndianCherokeeCheyenneChickasawChileanChineseChippewaChoctawColombianColvilleComancheCosta RicanCreeCreekCroatianCrowCubanCypriotCzechCzechoslovakianDanishDelawareDominicanDutchDutch West IndianEastern EuropeanEcuadorianEgyptianEnglishEstonianEthiopianEuropeanFijianFilipinoFinnishFrenchFrench American IndianFrench CanadianGermanGerman RussianGhanaianGreekGuamanian/ChamorroGuatemalanGuyaneseHaitianHmongHonduranHopiHoumaHungarianIcelanderIndian (Asian)IndonesianInupiatIranianIraqiIrishIroquoisIsraeliItalianJamaicanJapaneseJordanianKenyanKiowaKoreanLaotianLatvianLebaneseLiberianLithuanianLumbeeLuxembourgerMacedonianMalaysianMalteseMarshalleseMenomineeMexicanMexican American IndianMongolianMoroccanNative HawaiianNavajoNepaleseNew ZealanderNicaraguanNigerianNorthern EuropeanNorwegianOkinawanOsageOttawaPaiutePakistaniPalestinianPanamanianParaguayanPennsylvania GermanPeruvianPimaPolishPortuguesePotawatomiPuebloPuerto RicanPuget Sound SalishRomanianRussianSalvadoranSamoanScandinavianScotch-IrishScottishSeminoleSenegaleseSerbianShoshoneSierra LeoneanSiouxSlavicSlovakSloveneSomaliSouth AfricanSouth AmericanSouth American IndianSoviet UnionSpaniardSpanishSpanish AmericanSpanish American IndianSri LankanSubsaharan AfricanSudaneseSwedishSwissSyrianTaiwaneseThaiTlingit-HaidaTohono O'OdhamTonganTrinidadian and TobagonianTsimshianTurkishU.S. Virgin IslanderUgandanUkrainianUruguayanUteVenezuelanVietnameseWelshWest IndianYakamaYaquiYugoslavianYumanYup'ikZimbabwean
Immigration
NonimmigrantsImmigrantsAfghanistanAfricaAlbaniaArgentinaArmeniaAsiaAustraliaAustriaBahamasBangladeshBarbadosBelarusBelgiumBelizeBoliviaBosnia and HerzegovinaBrazilBulgariaBurma/MyanmarCabo VerdeCambodiaCameroonCanadaCaribbeanCentral AmericaChileChinaColombiaCongoCosta RicaCroatiaCubaCzechoslovakiaDenmarkDominicaDominican RepublicEastern AfricaEastern AsiaEastern EuropeEcuadorEgyptEl SalvadorEnglandEritreaEthiopiaEuropeFijiFranceGermanyGhanaGreeceGrenadaGuatemalaGuyanaHaitiHondurasHong KongHungaryIndiaIndonesiaIranIraqIrelandIsraelItalyJamaicaJapanJordanKazakhstanKenyaKoreaKuwaitLaosLatin AmericaLatviaLebanonLiberiaLithuaniaMalaysiaMexicoMicronesiaMiddle AfricaMoldovaMoroccoNepalNetherlandsNicaraguaNigeriaNorth AmericaNorth MacedoniaNorthern AfricaNorthern EuropeNorwayOceaniaPakistanPanamaPeruPhilippinesPolandPortugalRomaniaRussiaScotlandSenegalSerbiaSierra LeoneSingaporeSomaliaSouth AfricaSouth AmericaSouth Central AsiaSouth Eastern AsiaSouthern EuropeSpainSri LankaSt. Vincent and the GrenadinesSudanSwedenSwitzerlandSyriaTaiwanThailandTrinidad and TobagoTurkeyUgandaUkraineUruguayUzbekistanVenezuelaVietnamWest IndiesWestern AfricaWestern AsiaWestern EuropeYemenZaireZimbabweAzores
Self-Care Disability
Income
Poverty
Unemployment
Labor Participation
Family Structure
Vehicle Availability
Education Level
Disability

Immigrants from Saudi Arabia Self-Care Disability
Exceptional

2.2%
SELF-CARE DISABILITY
100.0/ 100
METRIC RATING
17th/ 347
METRIC RANK

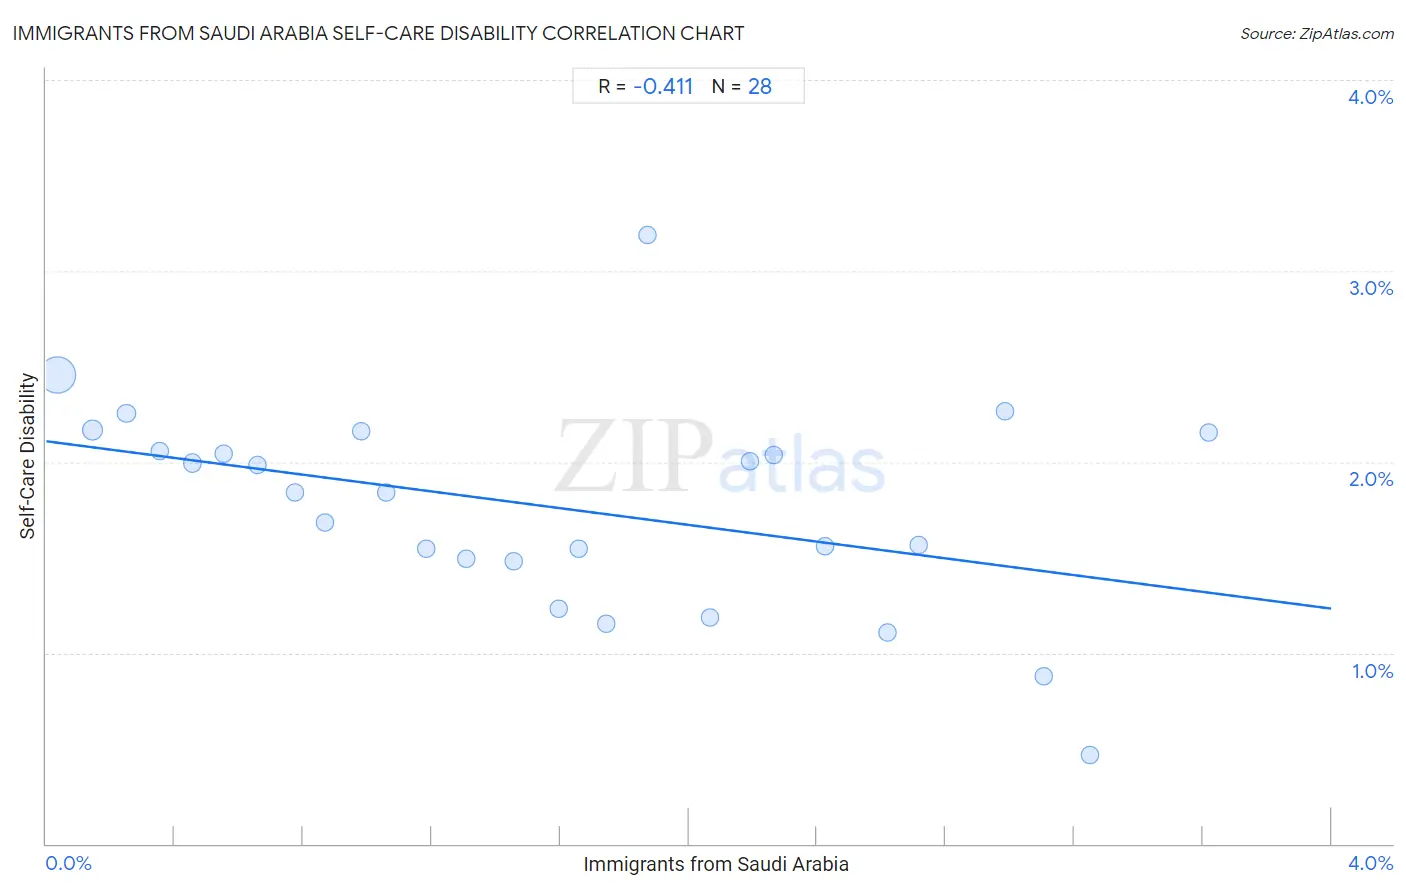
Immigrants from Saudi Arabia Self-Care Disability Correlation Chart

The statistical analysis conducted on geographies consisting of 164,197,287 people shows a moderate negative correlation between the proportion of Immigrants from Saudi Arabia and percentage of population with self-care disability in the United States with a correlation coefficient (R) of -0.411 and weighted average of 2.2%. On average, for every 1% (one percent) increase in Immigrants from Saudi Arabia within a typical geography, there is a decrease of 0.22% in percentage of population with self-care disability.
Immigrants from Saudi Arabia Self-Care Disability
It is essential to understand that the correlation between the percentage of Immigrants from Saudi Arabia and percentage of population with self-care disability does not imply a direct cause-and-effect relationship. It remains uncertain whether the presence of Immigrants from Saudi Arabia influences an upward or downward trend in the level of percentage of population with self-care disability within an area, or if Immigrants from Saudi Arabia simply ended up residing in those areas with higher or lower levels of percentage of population with self-care disability due to other factors.

Demographics Similar to Immigrants from Saudi Arabia by Self-Care Disability

In terms of self-care disability, the demographic groups most similar to Immigrants from Saudi Arabia are Immigrants from Kuwait (2.2%, a difference of 0.16%), Immigrants from Taiwan (2.2%, a difference of 0.25%), Okinawan (2.2%, a difference of 0.44%), Luxembourger (2.2%, a difference of 0.45%), and Immigrants from Eritrea (2.2%, a difference of 0.59%).
DemographicsRating | RankSelf-Care Disability
Sudanese
100.0
/100
|
#10
Exceptional
2.2%
Immigrants from South Central Asia
100.0
/100
|
#11
Exceptional
2.2%
Immigrants from Ethiopia
100.0
/100
|
#12
Exceptional
2.2%
Ethiopians
100.0
/100
|
#13
Exceptional
2.2%
Luxembourgers
100.0
/100
|
#14
Exceptional
2.2%
Okinawans
100.0
/100
|
#15
Exceptional
2.2%
Immigrants from Kuwait
100.0
/100
|
#16
Exceptional
2.2%
Immigrants from Saudi Arabia
100.0
/100
|
#17
Exceptional
2.2%
Immigrants from Taiwan
100.0
/100
|
#18
Exceptional
2.2%
Immigrants from Eritrea
100.0
/100
|
#19
Exceptional
2.2%
Tongans
100.0
/100
|
#20
Exceptional
2.2%
Bulgarians
100.0
/100
|
#21
Exceptional
2.2%
Immigrants from Venezuela
100.0
/100
|
#22
Exceptional
2.2%
Cambodians
100.0
/100
|
#23
Exceptional
2.2%
Cypriots
100.0
/100
|
#24
Exceptional
2.2%

Immigrants from Saudi Arabia Self-Care Disability Correlation Summary

MeasurementImmigrants from Saudi Arabia DataSelf-Care Disability Data
Minimum0.033%0.47%
Maximum3.6%3.2%
Range3.6%2.7%
Mean1.6%1.8%
Median1.5%1.8%
Interquartile 25% (IQ1)0.72%1.5%
Interquartile 75% (IQ3)2.3%2.1%
Interquartile Range (IQR)1.6%0.62%
Standard Deviation (Sample)1.0%0.55%
Standard Deviation (Population)1.0%0.54%

Correlation Details

Immigrants from Saudi Arabia PercentileSample SizeSelf-Care Disability
[
0.0%
-
0.5%
]
0.033%
134,784,7372.5%
[
0.0%
-
0.5%
]
0.14%
17,150,4022.2%
[
0.0%
-
0.5%
]
0.25%
5,666,5422.3%
[
0.0%
-
0.5%
]
0.35%
2,777,0522.1%
[
0.0%
-
0.5%
]
0.45%
1,355,3642.0%
[
0.5%
-
1.0%
]
0.55%
622,5342.0%
[
0.5%
-
1.0%
]
0.66%
428,7602.0%
[
0.5%
-
1.0%
]
0.77%
509,2781.8%
[
0.5%
-
1.0%
]
0.87%
171,3861.7%
[
0.5%
-
1.0%
]
0.98%
215,1252.2%
[
1.0%
-
1.5%
]
1.06%
216,5231.8%
[
1.0%
-
1.5%
]
1.18%
71,4471.5%
[
1.0%
-
1.5%
]
1.31%
45,5201.5%
[
1.0%
-
1.5%
]
1.45%
23,3171.5%
[
1.5%
-
2.0%
]
1.60%
5,4501.2%
[
1.5%
-
2.0%
]
1.66%
11,8771.5%
[
1.5%
-
2.0%
]
1.74%
36,2081.2%
[
1.5%
-
2.0%
]
1.87%
18,3113.2%
[
2.0%
-
2.5%
]
2.06%
7,6541.2%
[
2.0%
-
2.5%
]
2.19%
10,5882.0%
[
2.0%
-
2.5%
]
2.27%
13,8142.0%
[
2.0%
-
2.5%
]
2.42%
9,6911.6%
[
2.5%
-
3.0%
]
2.62%
21,0001.1%
[
2.5%
-
3.0%
]
2.71%
8,6581.6%
[
2.5%
-
3.0%
]
2.98%
8,6502.3%
[
3.0%
-
3.5%
]
3.11%
5,0880.88%
[
3.0%
-
3.5%
]
3.25%
1,7860.47%
[
3.5%
-
4.0%
]
3.62%
5252.2%