Greek Self-Care Disability

COMPARE

Greek
Race
Ancestry
AfghanAfricanAlaska NativeAlaskan AthabascanAlbanianAleutAlsatianAmericanApacheArabArapahoArgentineanArmenianAssyrian/Chaldean/SyriacAustralianAustrianBahamianBangladeshiBarbadianBasqueBelgianBelizeanBermudanBhutaneseBlackfeetBolivianBrazilianBritishBritish West IndianBulgarianBurmeseCajunCambodianCanadianCape VerdeanCarpatho RusynCelticCentral AmericanCentral American IndianCherokeeCheyenneChickasawChileanChineseChippewaChoctawColombianColvilleComancheCosta RicanCreeCreekCroatianCrowCubanCypriotCzechCzechoslovakianDanishDelawareDominicanDutchDutch West IndianEastern EuropeanEcuadorianEgyptianEnglishEstonianEthiopianEuropeanFijianFilipinoFinnishFrenchFrench American IndianFrench CanadianGermanGerman RussianGhanaianGreekGuamanian/ChamorroGuatemalanGuyaneseHaitianHmongHonduranHopiHoumaHungarianIcelanderIndian (Asian)IndonesianInupiatIranianIraqiIrishIroquoisIsraeliItalianJamaicanJapaneseJordanianKenyanKiowaKoreanLaotianLatvianLebaneseLiberianLithuanianLumbeeLuxembourgerMacedonianMalaysianMalteseMarshalleseMenomineeMexicanMexican American IndianMongolianMoroccanNative HawaiianNavajoNepaleseNew ZealanderNicaraguanNigerianNorthern EuropeanNorwegianOkinawanOsageOttawaPaiutePakistaniPalestinianPanamanianParaguayanPennsylvania GermanPeruvianPimaPolishPortuguesePotawatomiPuebloPuerto RicanPuget Sound SalishRomanianRussianSalvadoranSamoanScandinavianScotch-IrishScottishSeminoleSenegaleseSerbianShoshoneSierra LeoneanSiouxSlavicSlovakSloveneSomaliSouth AfricanSouth AmericanSouth American IndianSoviet UnionSpaniardSpanishSpanish AmericanSpanish American IndianSri LankanSubsaharan AfricanSudaneseSwedishSwissSyrianTaiwaneseThaiTlingit-HaidaTohono O'OdhamTonganTrinidadian and TobagonianTsimshianTurkishU.S. Virgin IslanderUgandanUkrainianUruguayanUteVenezuelanVietnameseWelshWest IndianYakamaYaquiYugoslavianYumanYup'ikZimbabwean
Immigration
NonimmigrantsImmigrantsAfghanistanAfricaAlbaniaArgentinaArmeniaAsiaAustraliaAustriaBahamasBangladeshBarbadosBelarusBelgiumBelizeBoliviaBosnia and HerzegovinaBrazilBulgariaBurma/MyanmarCabo VerdeCambodiaCameroonCanadaCaribbeanCentral AmericaChileChinaColombiaCongoCosta RicaCroatiaCubaCzechoslovakiaDenmarkDominicaDominican RepublicEastern AfricaEastern AsiaEastern EuropeEcuadorEgyptEl SalvadorEnglandEritreaEthiopiaEuropeFijiFranceGermanyGhanaGreeceGrenadaGuatemalaGuyanaHaitiHondurasHong KongHungaryIndiaIndonesiaIranIraqIrelandIsraelItalyJamaicaJapanJordanKazakhstanKenyaKoreaKuwaitLaosLatin AmericaLatviaLebanonLiberiaLithuaniaMalaysiaMexicoMicronesiaMiddle AfricaMoldovaMoroccoNepalNetherlandsNicaraguaNigeriaNorth AmericaNorth MacedoniaNorthern AfricaNorthern EuropeNorwayOceaniaPakistanPanamaPeruPhilippinesPolandPortugalRomaniaRussiaSaudi ArabiaScotlandSenegalSerbiaSierra LeoneSingaporeSomaliaSouth AfricaSouth AmericaSouth Central AsiaSouth Eastern AsiaSouthern EuropeSpainSri LankaSt. Vincent and the GrenadinesSudanSwedenSwitzerlandSyriaTaiwanThailandTrinidad and TobagoTurkeyUgandaUkraineUruguayUzbekistanVenezuelaVietnamWest IndiesWestern AfricaWestern AsiaWestern EuropeYemenZaireZimbabweAzores
Select to Compare
Race
Ancestry
AfghanAfricanAlaska NativeAlaskan AthabascanAlbanianAleutAlsatianAmericanApacheArabArapahoArgentineanArmenianAssyrian/Chaldean/SyriacAustralianAustrianBahamianBangladeshiBarbadianBasqueBelgianBelizeanBermudanBhutaneseBlackfeetBolivianBrazilianBritishBritish West IndianBulgarianBurmeseCajunCambodianCanadianCape VerdeanCarpatho RusynCelticCentral AmericanCentral American IndianCherokeeCheyenneChickasawChileanChineseChippewaChoctawColombianColvilleComancheCosta RicanCreeCreekCroatianCrowCubanCypriotCzechCzechoslovakianDanishDelawareDominicanDutchDutch West IndianEastern EuropeanEcuadorianEgyptianEnglishEstonianEthiopianEuropeanFijianFilipinoFinnishFrenchFrench American IndianFrench CanadianGermanGerman RussianGhanaianGuamanian/ChamorroGuatemalanGuyaneseHaitianHmongHonduranHopiHoumaHungarianIcelanderIndian (Asian)IndonesianInupiatIranianIraqiIrishIroquoisIsraeliItalianJamaicanJapaneseJordanianKenyanKiowaKoreanLaotianLatvianLebaneseLiberianLithuanianLumbeeLuxembourgerMacedonianMalaysianMalteseMarshalleseMenomineeMexicanMexican American IndianMongolianMoroccanNative HawaiianNavajoNepaleseNew ZealanderNicaraguanNigerianNorthern EuropeanNorwegianOkinawanOsageOttawaPaiutePakistaniPalestinianPanamanianParaguayanPennsylvania GermanPeruvianPimaPolishPortuguesePotawatomiPuebloPuerto RicanPuget Sound SalishRomanianRussianSalvadoranSamoanScandinavianScotch-IrishScottishSeminoleSenegaleseSerbianShoshoneSierra LeoneanSiouxSlavicSlovakSloveneSomaliSouth AfricanSouth AmericanSouth American IndianSoviet UnionSpaniardSpanishSpanish AmericanSpanish American IndianSri LankanSubsaharan AfricanSudaneseSwedishSwissSyrianTaiwaneseThaiTlingit-HaidaTohono O'OdhamTonganTrinidadian and TobagonianTsimshianTurkishU.S. Virgin IslanderUgandanUkrainianUruguayanUteVenezuelanVietnameseWelshWest IndianYakamaYaquiYugoslavianYumanYup'ikZimbabwean
Immigration
NonimmigrantsImmigrantsAfghanistanAfricaAlbaniaArgentinaArmeniaAsiaAustraliaAustriaBahamasBangladeshBarbadosBelarusBelgiumBelizeBoliviaBosnia and HerzegovinaBrazilBulgariaBurma/MyanmarCabo VerdeCambodiaCameroonCanadaCaribbeanCentral AmericaChileChinaColombiaCongoCosta RicaCroatiaCubaCzechoslovakiaDenmarkDominicaDominican RepublicEastern AfricaEastern AsiaEastern EuropeEcuadorEgyptEl SalvadorEnglandEritreaEthiopiaEuropeFijiFranceGermanyGhanaGreeceGrenadaGuatemalaGuyanaHaitiHondurasHong KongHungaryIndiaIndonesiaIranIraqIrelandIsraelItalyJamaicaJapanJordanKazakhstanKenyaKoreaKuwaitLaosLatin AmericaLatviaLebanonLiberiaLithuaniaMalaysiaMexicoMicronesiaMiddle AfricaMoldovaMoroccoNepalNetherlandsNicaraguaNigeriaNorth AmericaNorth MacedoniaNorthern AfricaNorthern EuropeNorwayOceaniaPakistanPanamaPeruPhilippinesPolandPortugalRomaniaRussiaSaudi ArabiaScotlandSenegalSerbiaSierra LeoneSingaporeSomaliaSouth AfricaSouth AmericaSouth Central AsiaSouth Eastern AsiaSouthern EuropeSpainSri LankaSt. Vincent and the GrenadinesSudanSwedenSwitzerlandSyriaTaiwanThailandTrinidad and TobagoTurkeyUgandaUkraineUruguayUzbekistanVenezuelaVietnamWest IndiesWestern AfricaWestern AsiaWestern EuropeYemenZaireZimbabweAzores
Self-Care Disability
Income
Poverty
Unemployment
Labor Participation
Family Structure
Vehicle Availability
Education Level
Disability

Greek Self-Care Disability
Exceptional

2.4%
SELF-CARE DISABILITY
94.1/ 100
METRIC RATING
108th/ 347
METRIC RANK

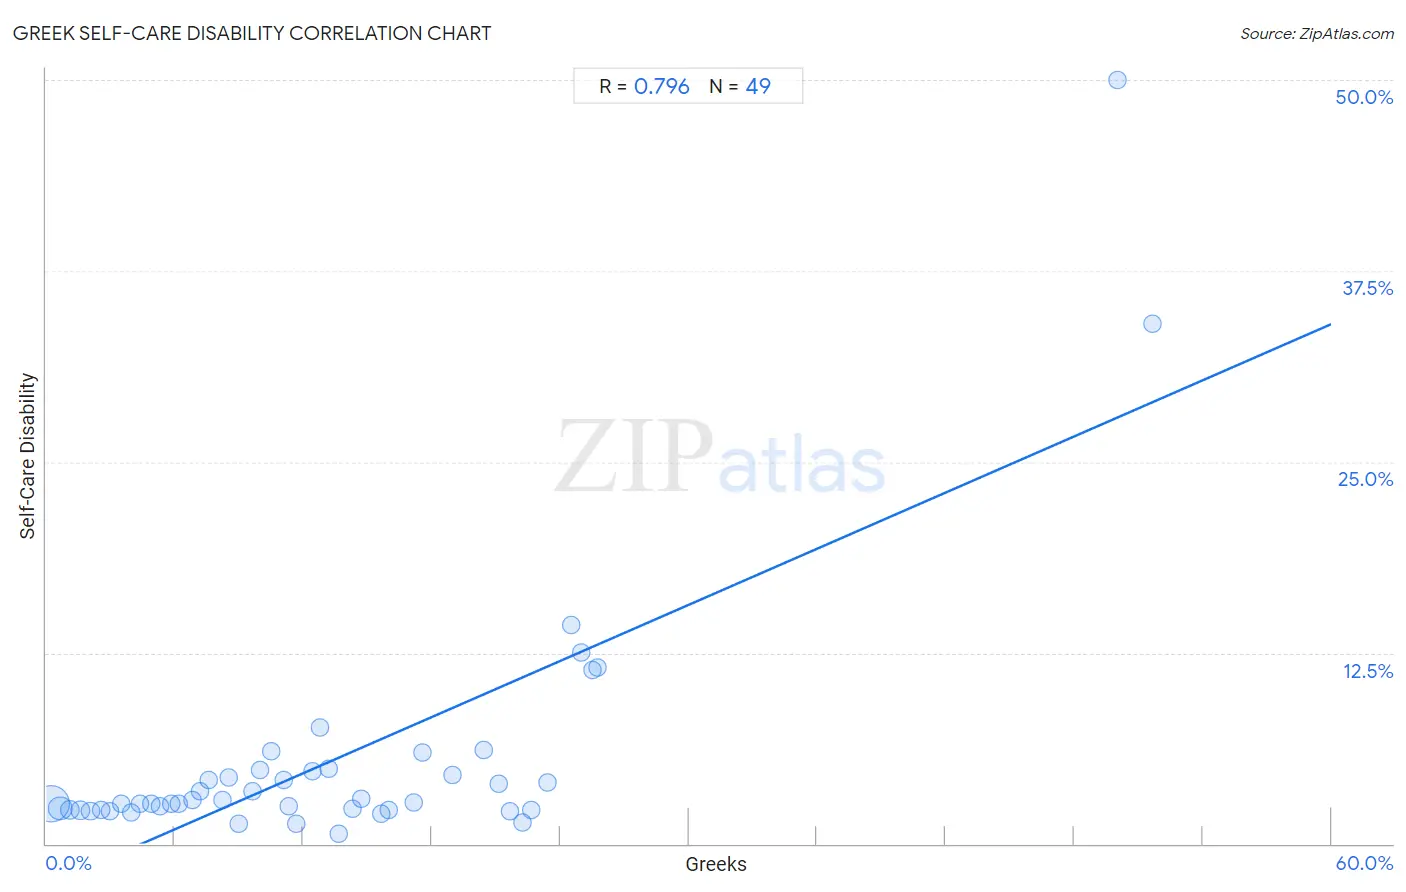
Greek Self-Care Disability Correlation Chart

The statistical analysis conducted on geographies consisting of 481,876,170 people shows a strong positive correlation between the proportion of Greeks and percentage of population with self-care disability in the United States with a correlation coefficient (R) of 0.796 and weighted average of 2.4%. On average, for every 1% (one percent) increase in Greeks within a typical geography, there is an increase of 0.61% in percentage of population with self-care disability.
Greek Self-Care Disability
It is essential to understand that the correlation between the percentage of Greeks and percentage of population with self-care disability does not imply a direct cause-and-effect relationship. It remains uncertain whether the presence of Greeks influences an upward or downward trend in the level of percentage of population with self-care disability within an area, or if Greeks simply ended up residing in those areas with higher or lower levels of percentage of population with self-care disability due to other factors.

Demographics Similar to Greeks by Self-Care Disability

In terms of self-care disability, the demographic groups most similar to Greeks are Slovene (2.4%, a difference of 0.010%), British (2.4%, a difference of 0.030%), Immigrants from Indonesia (2.4%, a difference of 0.040%), Carpatho Rusyn (2.4%, a difference of 0.050%), and Bhutanese (2.4%, a difference of 0.080%).
DemographicsRating | RankSelf-Care Disability
Immigrants from Scotland
95.7
/100
|
#101
Exceptional
2.4%
Croatians
95.0
/100
|
#102
Exceptional
2.4%
Alsatians
94.9
/100
|
#103
Exceptional
2.4%
Bhutanese
94.5
/100
|
#104
Exceptional
2.4%
Carpatho Rusyns
94.4
/100
|
#105
Exceptional
2.4%
Immigrants from Indonesia
94.3
/100
|
#106
Exceptional
2.4%
British
94.3
/100
|
#107
Exceptional
2.4%
Greeks
94.1
/100
|
#108
Exceptional
2.4%
Slovenes
94.1
/100
|
#109
Exceptional
2.4%
Immigrants from Africa
93.7
/100
|
#110
Exceptional
2.4%
Serbians
93.6
/100
|
#111
Exceptional
2.4%
Scandinavians
93.5
/100
|
#112
Exceptional
2.4%
South Americans
93.2
/100
|
#113
Exceptional
2.4%
Immigrants from North Macedonia
93.1
/100
|
#114
Exceptional
2.4%
Immigrants from Hong Kong
93.1
/100
|
#115
Exceptional
2.4%

Greek Self-Care Disability Correlation Summary

MeasurementGreek DataSelf-Care Disability Data
Minimum0.21%0.63%
Maximum51.6%50.0%
Range51.4%49.4%
Mean13.4%5.5%
Median11.3%2.7%
Interquartile 25% (IQ1)5.6%2.2%
Interquartile 75% (IQ3)19.7%4.8%
Interquartile Range (IQR)14.1%2.6%
Standard Deviation (Sample)10.8%8.3%
Standard Deviation (Population)10.7%8.2%

Correlation Details

Greek PercentileSample SizeSelf-Care Disability
[
0.0%
-
0.5%
]
0.21%
329,749,6252.6%
[
0.5%
-
1.0%
]
0.65%
102,944,2582.3%
[
1.0%
-
1.5%
]
1.11%
27,058,5872.2%
[
1.5%
-
2.0%
]
1.61%
10,942,0272.2%
[
2.0%
-
2.5%
]
2.06%
4,375,2892.1%
[
2.5%
-
3.0%
]
2.55%
2,835,5372.2%
[
2.5%
-
3.0%
]
3.00%
1,526,0532.1%
[
3.0%
-
3.5%
]
3.50%
781,6422.6%
[
3.5%
-
4.0%
]
3.95%
339,9502.1%
[
4.0%
-
4.5%
]
4.40%
502,2732.6%
[
4.5%
-
5.0%
]
4.91%
150,3192.6%
[
5.0%
-
5.5%
]
5.29%
162,8752.5%
[
5.5%
-
6.0%
]
5.82%
128,1922.6%
[
6.0%
-
6.5%
]
6.20%
102,6962.6%
[
6.5%
-
7.0%
]
6.80%
58,6322.9%
[
7.0%
-
7.5%
]
7.17%
83,2923.4%
[
7.5%
-
8.0%
]
7.59%
29,6594.2%
[
8.0%
-
8.5%
]
8.25%
3,0562.9%
[
8.0%
-
8.5%
]
8.50%
1,5894.3%
[
8.5%
-
9.0%
]
8.98%
9581.3%
[
9.5%
-
10.0%
]
9.65%
7,7413.5%
[
10.0%
-
10.5%
]
10.01%
6,9544.8%
[
10.5%
-
11.0%
]
10.50%
1,0196.0%
[
11.0%
-
11.5%
]
11.11%
12,2614.2%
[
11.0%
-
11.5%
]
11.31%
50,2502.4%
[
11.5%
-
12.0%
]
11.66%
1,8181.3%
[
12.0%
-
12.5%
]
12.42%
1,6424.7%
[
12.5%
-
13.0%
]
12.79%
1,2677.6%
[
13.0%
-
13.5%
]
13.17%
4634.9%
[
13.5%
-
14.0%
]
13.68%
6650.63%
[
14.0%
-
14.5%
]
14.29%
5252.3%
[
14.5%
-
15.0%
]
14.71%
3,5072.9%
[
15.5%
-
16.0%
]
15.62%
4,0652.0%
[
16.0%
-
16.5%
]
16.01%
1,4432.2%
[
17.0%
-
17.5%
]
17.15%
5832.7%
[
17.5%
-
18.0%
]
17.54%
4565.9%
[
18.5%
-
19.0%
]
18.95%
4384.5%
[
20.0%
-
20.5%
]
20.43%
4216.2%
[
21.0%
-
21.5%
]
21.15%
2,1513.9%
[
21.5%
-
22.0%
]
21.68%
1432.1%
[
22.0%
-
22.5%
]
22.22%
721.4%
[
22.5%
-
23.0%
]
22.63%
1372.2%
[
23.0%
-
23.5%
]
23.43%
7004.0%
[
24.0%
-
24.5%
]
24.49%
4914.3%
[
25.0%
-
25.5%
]
25.00%
812.5%
[
25.5%
-
26.0%
]
25.51%
39611.4%
[
25.5%
-
26.0%
]
25.77%
39211.5%
[
50.0%
-
50.5%
]
50.00%
450.0%
[
51.5%
-
52.0%
]
51.65%
9134.1%