Scotch-Irish College, Under 1 year
COMPARE
Scotch-Irish
Select to Compare
College, Under 1 year
Scotch-Irish College, Under 1 year
65.4%
COLLEGE, UNDER 1 YEAR
49.5/ 100
METRIC RATING
175th/ 347
METRIC RANK
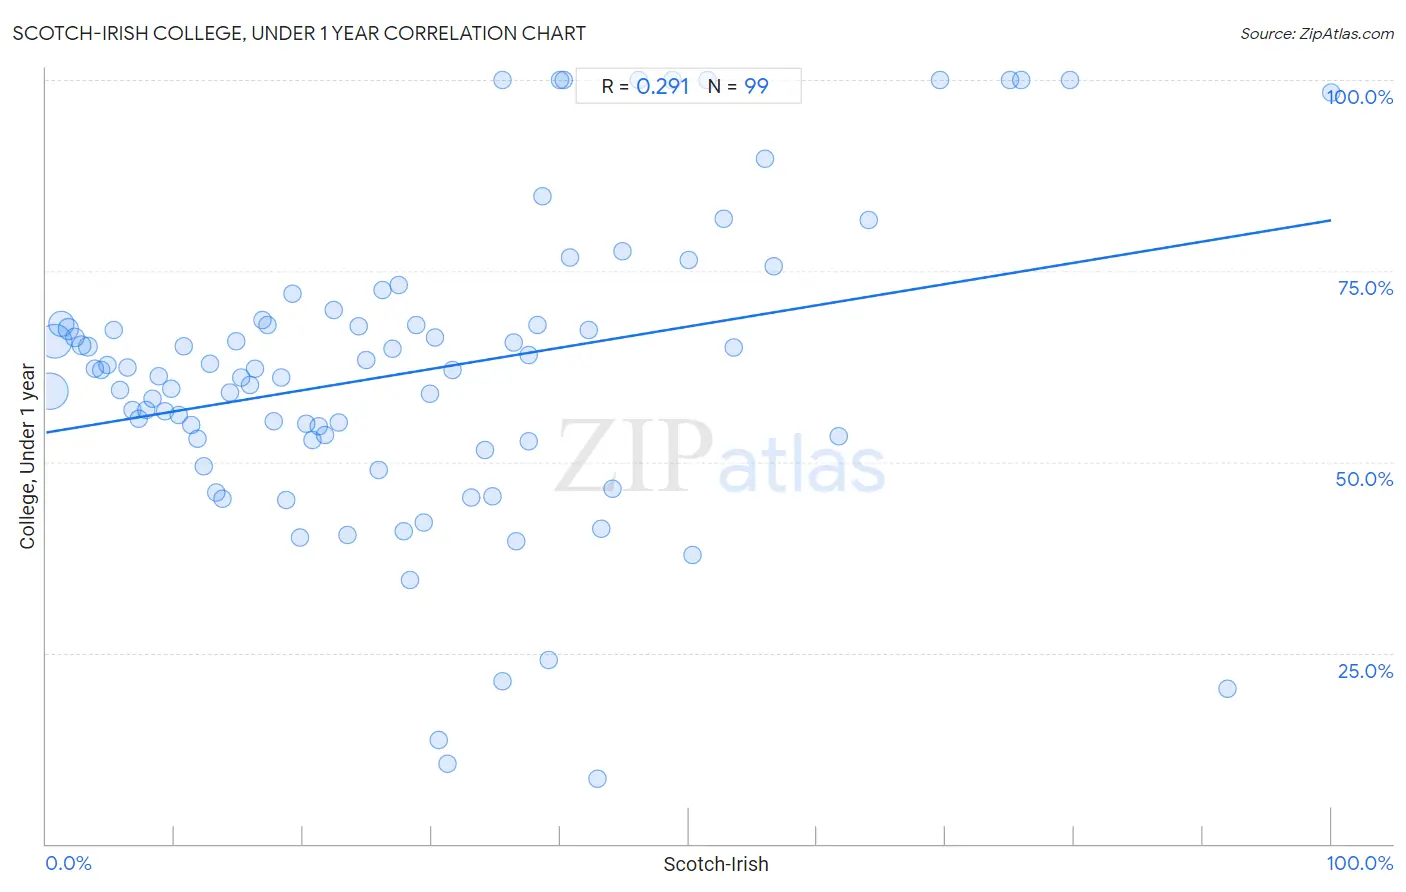
Scotch-Irish College, Under 1 year Correlation Chart
The statistical analysis conducted on geographies consisting of 548,775,844 people shows a weak positive correlation between the proportion of Scotch-Irish and percentage of population with at least college, under 1 year education in the United States with a correlation coefficient (R) of 0.291 and weighted average of 65.4%. On average, for every 1% (one percent) increase in Scotch-Irish within a typical geography, there is an increase of 0.28% in percentage of population with at least college, under 1 year education.
It is essential to understand that the correlation between the percentage of Scotch-Irish and percentage of population with at least college, under 1 year education does not imply a direct cause-and-effect relationship. It remains uncertain whether the presence of Scotch-Irish influences an upward or downward trend in the level of percentage of population with at least college, under 1 year education within an area, or if Scotch-Irish simply ended up residing in those areas with higher or lower levels of percentage of population with at least college, under 1 year education due to other factors.
Demographics Similar to Scotch-Irish by College, Under 1 year
In terms of college, under 1 year, the demographic groups most similar to Scotch-Irish are Immigrants from Bosnia and Herzegovina (65.4%, a difference of 0.020%), French (65.4%, a difference of 0.030%), Immigrants from North Macedonia (65.4%, a difference of 0.040%), German Russian (65.4%, a difference of 0.050%), and Guamanian/Chamorro (65.4%, a difference of 0.060%).
| Demographics | Rating | Rank | College, Under 1 year |
| Hungarians | 55.9 /100 | #168 | Average 65.6% |
| Yugoslavians | 55.7 /100 | #169 | Average 65.6% |
| Germans | 55.7 /100 | #170 | Average 65.6% |
| Immigrants from Oceania | 55.0 /100 | #171 | Average 65.6% |
| South American Indians | 54.4 /100 | #172 | Average 65.5% |
| Swiss | 53.9 /100 | #173 | Average 65.5% |
| Immigrants from Bosnia and Herzegovina | 50.0 /100 | #174 | Average 65.4% |
| Scotch-Irish | 49.5 /100 | #175 | Average 65.4% |
| French | 48.9 /100 | #176 | Average 65.4% |
| Immigrants from North Macedonia | 48.6 /100 | #177 | Average 65.4% |
| German Russians | 48.3 /100 | #178 | Average 65.4% |
| Guamanians/Chamorros | 48.2 /100 | #179 | Average 65.4% |
| Dutch | 46.1 /100 | #180 | Average 65.3% |
| Spaniards | 45.5 /100 | #181 | Average 65.3% |
| Immigrants from Africa | 44.7 /100 | #182 | Average 65.3% |
Scotch-Irish College, Under 1 year Correlation Summary
| Measurement | Scotch-Irish Data | College, Under 1 year Data |
| Minimum | 0.25% | 8.6% |
| Maximum | 100.0% | 100.0% |
| Range | 99.7% | 91.4% |
| Mean | 28.6% | 61.8% |
| Median | 25.8% | 62.1% |
| Interquartile 25% (IQ1) | 12.2% | 52.8% |
| Interquartile 75% (IQ3) | 40.0% | 68.1% |
| Interquartile Range (IQR) | 27.8% | 15.3% |
| Standard Deviation (Sample) | 20.9% | 20.0% |
| Standard Deviation (Population) | 20.8% | 19.9% |
Correlation Details
| Scotch-Irish Percentile | Sample Size | College, Under 1 year |
[ 0.0% - 0.5% ] 0.25% | 210,821,371 | 59.2% |
[ 0.5% - 1.0% ] 0.72% | 183,292,602 | 65.7% |
[ 1.0% - 1.5% ] 1.21% | 82,718,688 | 68.1% |
[ 1.5% - 2.0% ] 1.72% | 36,476,205 | 67.4% |
[ 2.0% - 2.5% ] 2.21% | 15,922,730 | 66.3% |
[ 2.5% - 3.0% ] 2.73% | 7,866,836 | 65.3% |
[ 3.0% - 3.5% ] 3.23% | 5,139,772 | 65.1% |
[ 3.5% - 4.0% ] 3.75% | 2,465,049 | 62.3% |
[ 4.0% - 4.5% ] 4.25% | 1,279,821 | 62.1% |
[ 4.5% - 5.0% ] 4.76% | 753,049 | 62.7% |
[ 5.0% - 5.5% ] 5.23% | 645,028 | 67.3% |
[ 5.5% - 6.0% ] 5.71% | 327,486 | 59.4% |
[ 6.0% - 6.5% ] 6.29% | 211,937 | 62.3% |
[ 6.5% - 7.0% ] 6.71% | 140,241 | 56.7% |
[ 7.0% - 7.5% ] 7.24% | 123,134 | 55.7% |
[ 7.5% - 8.0% ] 7.78% | 113,646 | 56.9% |
[ 8.0% - 8.5% ] 8.22% | 77,398 | 58.2% |
[ 8.5% - 9.0% ] 8.75% | 61,743 | 61.1% |
[ 9.0% - 9.5% ] 9.25% | 40,511 | 56.6% |
[ 9.5% - 10.0% ] 9.76% | 39,259 | 59.5% |
[ 10.0% - 10.5% ] 10.27% | 39,547 | 56.2% |
[ 10.5% - 11.0% ] 10.70% | 27,649 | 65.1% |
[ 11.0% - 11.5% ] 11.24% | 20,175 | 54.9% |
[ 11.5% - 12.0% ] 11.80% | 18,678 | 53.1% |
[ 12.0% - 12.5% ] 12.23% | 9,506 | 49.4% |
[ 12.5% - 13.0% ] 12.75% | 5,191 | 62.8% |
[ 13.0% - 13.5% ] 13.22% | 19,170 | 46.0% |
[ 13.5% - 14.0% ] 13.70% | 16,987 | 45.1% |
[ 14.0% - 14.5% ] 14.26% | 16,611 | 59.1% |
[ 14.5% - 15.0% ] 14.82% | 3,692 | 65.8% |
[ 15.0% - 15.5% ] 15.17% | 6,541 | 61.0% |
[ 15.5% - 16.0% ] 15.86% | 5,689 | 60.0% |
[ 16.0% - 16.5% ] 16.20% | 11,312 | 62.2% |
[ 16.5% - 17.0% ] 16.81% | 5,163 | 68.6% |
[ 17.0% - 17.5% ] 17.25% | 8,190 | 68.0% |
[ 17.5% - 18.0% ] 17.67% | 9,402 | 55.3% |
[ 18.0% - 18.5% ] 18.30% | 2,300 | 61.1% |
[ 18.5% - 19.0% ] 18.65% | 3,018 | 45.0% |
[ 19.0% - 19.5% ] 19.19% | 2,356 | 71.9% |
[ 19.5% - 20.0% ] 19.72% | 1,359 | 40.1% |
[ 20.0% - 20.5% ] 20.26% | 770 | 55.0% |
[ 20.5% - 21.0% ] 20.75% | 3,046 | 52.8% |
[ 21.0% - 21.5% ] 21.24% | 1,356 | 54.7% |
[ 21.5% - 22.0% ] 21.70% | 1,972 | 53.5% |
[ 22.0% - 22.5% ] 22.39% | 67 | 69.9% |
[ 22.5% - 23.0% ] 22.77% | 1,458 | 55.2% |
[ 23.0% - 23.5% ] 23.41% | 1,072 | 40.5% |
[ 24.0% - 24.5% ] 24.31% | 288 | 67.8% |
[ 24.5% - 25.0% ] 24.86% | 1,943 | 63.3% |
[ 25.5% - 26.0% ] 25.83% | 724 | 49.0% |
[ 26.0% - 26.5% ] 26.17% | 405 | 72.5% |
[ 26.5% - 27.0% ] 26.91% | 431 | 64.8% |
[ 27.0% - 27.5% ] 27.42% | 383 | 73.2% |
[ 27.5% - 28.0% ] 27.85% | 237 | 40.8% |
[ 28.0% - 28.5% ] 28.26% | 92 | 34.5% |
[ 28.5% - 29.0% ] 28.75% | 473 | 67.8% |
[ 29.0% - 29.5% ] 29.40% | 500 | 42.0% |
[ 29.5% - 30.0% ] 29.83% | 905 | 59.0% |
[ 30.0% - 30.5% ] 30.25% | 3,223 | 66.3% |
[ 30.5% - 31.0% ] 30.57% | 386 | 13.6% |
[ 31.0% - 31.5% ] 31.25% | 32 | 10.5% |
[ 31.5% - 32.0% ] 31.65% | 79 | 62.0% |
[ 33.0% - 33.5% ] 33.12% | 157 | 45.3% |
[ 34.0% - 34.5% ] 34.17% | 1,080 | 51.6% |
[ 34.5% - 35.0% ] 34.73% | 357 | 45.5% |
[ 35.0% - 35.5% ] 35.46% | 141 | 21.3% |
[ 35.5% - 36.0% ] 35.54% | 166 | 100.0% |
[ 36.0% - 36.5% ] 36.40% | 728 | 65.7% |
[ 36.5% - 37.0% ] 36.53% | 605 | 39.6% |
[ 37.0% - 37.5% ] 37.50% | 72 | 52.6% |
[ 37.5% - 38.0% ] 37.58% | 157 | 64.1% |
[ 38.0% - 38.5% ] 38.18% | 55 | 67.9% |
[ 38.5% - 39.0% ] 38.60% | 171 | 84.8% |
[ 39.0% - 39.5% ] 39.08% | 87 | 24.1% |
[ 40.0% - 40.5% ] 40.00% | 5 | 100.0% |
[ 40.0% - 40.5% ] 40.23% | 87 | 100.0% |
[ 40.5% - 41.0% ] 40.78% | 103 | 76.8% |
[ 42.0% - 42.5% ] 42.19% | 64 | 67.2% |
[ 42.5% - 43.0% ] 42.86% | 35 | 8.6% |
[ 43.0% - 43.5% ] 43.17% | 556 | 41.3% |
[ 44.0% - 44.5% ] 44.08% | 338 | 46.5% |
[ 44.5% - 45.0% ] 44.84% | 339 | 77.6% |
[ 46.0% - 46.5% ] 46.09% | 115 | 100.0% |
[ 48.5% - 49.0% ] 48.72% | 78 | 100.0% |
[ 50.0% - 50.5% ] 50.00% | 72 | 76.4% |
[ 50.0% - 50.5% ] 50.34% | 149 | 37.8% |
[ 51.0% - 51.5% ] 51.43% | 35 | 100.0% |
[ 52.5% - 53.0% ] 52.73% | 55 | 81.8% |
[ 53.5% - 54.0% ] 53.51% | 299 | 65.0% |
[ 55.5% - 56.0% ] 55.93% | 59 | 89.7% |
[ 56.5% - 57.0% ] 56.63% | 83 | 75.7% |
[ 61.5% - 62.0% ] 61.67% | 60 | 53.3% |
[ 64.0% - 64.5% ] 64.00% | 175 | 81.7% |
[ 69.5% - 70.0% ] 69.57% | 23 | 100.0% |
[ 75.0% - 75.5% ] 75.00% | 20 | 100.0% |
[ 75.5% - 76.0% ] 75.86% | 29 | 100.0% |
[ 79.5% - 80.0% ] 79.66% | 59 | 100.0% |
[ 91.5% - 92.0% ] 91.89% | 222 | 20.2% |
[ 99.5% - 100.0% ] 100.00% | 124 | 98.4% |