Somali Self-Care Disability

COMPARE

Somali
Race
Ancestry
AfghanAfricanAlaska NativeAlaskan AthabascanAlbanianAleutAlsatianAmericanApacheArabArapahoArgentineanArmenianAssyrian/Chaldean/SyriacAustralianAustrianBahamianBangladeshiBarbadianBasqueBelgianBelizeanBermudanBhutaneseBlackfeetBolivianBrazilianBritishBritish West IndianBulgarianBurmeseCajunCambodianCanadianCape VerdeanCarpatho RusynCelticCentral AmericanCentral American IndianCherokeeCheyenneChickasawChileanChineseChippewaChoctawColombianColvilleComancheCosta RicanCreeCreekCroatianCrowCubanCypriotCzechCzechoslovakianDanishDelawareDominicanDutchDutch West IndianEastern EuropeanEcuadorianEgyptianEnglishEstonianEthiopianEuropeanFijianFilipinoFinnishFrenchFrench American IndianFrench CanadianGermanGerman RussianGhanaianGreekGuamanian/ChamorroGuatemalanGuyaneseHaitianHmongHonduranHopiHoumaHungarianIcelanderIndian (Asian)IndonesianInupiatIranianIraqiIrishIroquoisIsraeliItalianJamaicanJapaneseJordanianKenyanKiowaKoreanLaotianLatvianLebaneseLiberianLithuanianLumbeeLuxembourgerMacedonianMalaysianMalteseMarshalleseMenomineeMexicanMexican American IndianMongolianMoroccanNative HawaiianNavajoNepaleseNew ZealanderNicaraguanNigerianNorthern EuropeanNorwegianOkinawanOsageOttawaPaiutePakistaniPalestinianPanamanianParaguayanPennsylvania GermanPeruvianPimaPolishPortuguesePotawatomiPuebloPuerto RicanPuget Sound SalishRomanianRussianSalvadoranSamoanScandinavianScotch-IrishScottishSeminoleSenegaleseSerbianShoshoneSierra LeoneanSiouxSlavicSlovakSloveneSomaliSouth AfricanSouth AmericanSouth American IndianSoviet UnionSpaniardSpanishSpanish AmericanSpanish American IndianSri LankanSubsaharan AfricanSudaneseSwedishSwissSyrianTaiwaneseThaiTlingit-HaidaTohono O'OdhamTonganTrinidadian and TobagonianTsimshianTurkishU.S. Virgin IslanderUgandanUkrainianUruguayanUteVenezuelanVietnameseWelshWest IndianYakamaYaquiYugoslavianYumanYup'ikZimbabwean
Immigration
NonimmigrantsImmigrantsAfghanistanAfricaAlbaniaArgentinaArmeniaAsiaAustraliaAustriaBahamasBangladeshBarbadosBelarusBelgiumBelizeBoliviaBosnia and HerzegovinaBrazilBulgariaBurma/MyanmarCabo VerdeCambodiaCameroonCanadaCaribbeanCentral AmericaChileChinaColombiaCongoCosta RicaCroatiaCubaCzechoslovakiaDenmarkDominicaDominican RepublicEastern AfricaEastern AsiaEastern EuropeEcuadorEgyptEl SalvadorEnglandEritreaEthiopiaEuropeFijiFranceGermanyGhanaGreeceGrenadaGuatemalaGuyanaHaitiHondurasHong KongHungaryIndiaIndonesiaIranIraqIrelandIsraelItalyJamaicaJapanJordanKazakhstanKenyaKoreaKuwaitLaosLatin AmericaLatviaLebanonLiberiaLithuaniaMalaysiaMexicoMicronesiaMiddle AfricaMoldovaMoroccoNepalNetherlandsNicaraguaNigeriaNorth AmericaNorth MacedoniaNorthern AfricaNorthern EuropeNorwayOceaniaPakistanPanamaPeruPhilippinesPolandPortugalRomaniaRussiaSaudi ArabiaScotlandSenegalSerbiaSierra LeoneSingaporeSomaliaSouth AfricaSouth AmericaSouth Central AsiaSouth Eastern AsiaSouthern EuropeSpainSri LankaSt. Vincent and the GrenadinesSudanSwedenSwitzerlandSyriaTaiwanThailandTrinidad and TobagoTurkeyUgandaUkraineUruguayUzbekistanVenezuelaVietnamWest IndiesWestern AfricaWestern AsiaWestern EuropeYemenZaireZimbabweAzores
Select to Compare
Race
Ancestry
AfghanAfricanAlaska NativeAlaskan AthabascanAlbanianAleutAlsatianAmericanApacheArabArapahoArgentineanArmenianAssyrian/Chaldean/SyriacAustralianAustrianBahamianBangladeshiBarbadianBasqueBelgianBelizeanBermudanBhutaneseBlackfeetBolivianBrazilianBritishBritish West IndianBulgarianBurmeseCajunCambodianCanadianCape VerdeanCarpatho RusynCelticCentral AmericanCentral American IndianCherokeeCheyenneChickasawChileanChineseChippewaChoctawColombianColvilleComancheCosta RicanCreeCreekCroatianCrowCubanCypriotCzechCzechoslovakianDanishDelawareDominicanDutchDutch West IndianEastern EuropeanEcuadorianEgyptianEnglishEstonianEthiopianEuropeanFijianFilipinoFinnishFrenchFrench American IndianFrench CanadianGermanGerman RussianGhanaianGreekGuamanian/ChamorroGuatemalanGuyaneseHaitianHmongHonduranHopiHoumaHungarianIcelanderIndian (Asian)IndonesianInupiatIranianIraqiIrishIroquoisIsraeliItalianJamaicanJapaneseJordanianKenyanKiowaKoreanLaotianLatvianLebaneseLiberianLithuanianLumbeeLuxembourgerMacedonianMalaysianMalteseMarshalleseMenomineeMexicanMexican American IndianMongolianMoroccanNative HawaiianNavajoNepaleseNew ZealanderNicaraguanNigerianNorthern EuropeanNorwegianOkinawanOsageOttawaPaiutePakistaniPalestinianPanamanianParaguayanPennsylvania GermanPeruvianPimaPolishPortuguesePotawatomiPuebloPuerto RicanPuget Sound SalishRomanianRussianSalvadoranSamoanScandinavianScotch-IrishScottishSeminoleSenegaleseSerbianShoshoneSierra LeoneanSiouxSlavicSlovakSloveneSouth AfricanSouth AmericanSouth American IndianSoviet UnionSpaniardSpanishSpanish AmericanSpanish American IndianSri LankanSubsaharan AfricanSudaneseSwedishSwissSyrianTaiwaneseThaiTlingit-HaidaTohono O'OdhamTonganTrinidadian and TobagonianTsimshianTurkishU.S. Virgin IslanderUgandanUkrainianUruguayanUteVenezuelanVietnameseWelshWest IndianYakamaYaquiYugoslavianYumanYup'ikZimbabwean
Immigration
NonimmigrantsImmigrantsAfghanistanAfricaAlbaniaArgentinaArmeniaAsiaAustraliaAustriaBahamasBangladeshBarbadosBelarusBelgiumBelizeBoliviaBosnia and HerzegovinaBrazilBulgariaBurma/MyanmarCabo VerdeCambodiaCameroonCanadaCaribbeanCentral AmericaChileChinaColombiaCongoCosta RicaCroatiaCubaCzechoslovakiaDenmarkDominicaDominican RepublicEastern AfricaEastern AsiaEastern EuropeEcuadorEgyptEl SalvadorEnglandEritreaEthiopiaEuropeFijiFranceGermanyGhanaGreeceGrenadaGuatemalaGuyanaHaitiHondurasHong KongHungaryIndiaIndonesiaIranIraqIrelandIsraelItalyJamaicaJapanJordanKazakhstanKenyaKoreaKuwaitLaosLatin AmericaLatviaLebanonLiberiaLithuaniaMalaysiaMexicoMicronesiaMiddle AfricaMoldovaMoroccoNepalNetherlandsNicaraguaNigeriaNorth AmericaNorth MacedoniaNorthern AfricaNorthern EuropeNorwayOceaniaPakistanPanamaPeruPhilippinesPolandPortugalRomaniaRussiaSaudi ArabiaScotlandSenegalSerbiaSierra LeoneSingaporeSomaliaSouth AfricaSouth AmericaSouth Central AsiaSouth Eastern AsiaSouthern EuropeSpainSri LankaSt. Vincent and the GrenadinesSudanSwedenSwitzerlandSyriaTaiwanThailandTrinidad and TobagoTurkeyUgandaUkraineUruguayUzbekistanVenezuelaVietnamWest IndiesWestern AfricaWestern AsiaWestern EuropeYemenZaireZimbabweAzores
Self-Care Disability
Income
Poverty
Unemployment
Labor Participation
Family Structure
Vehicle Availability
Education Level
Disability

Somali Self-Care Disability
Good

2.5%
SELF-CARE DISABILITY
63.7/ 100
METRIC RATING
162nd/ 347
METRIC RANK

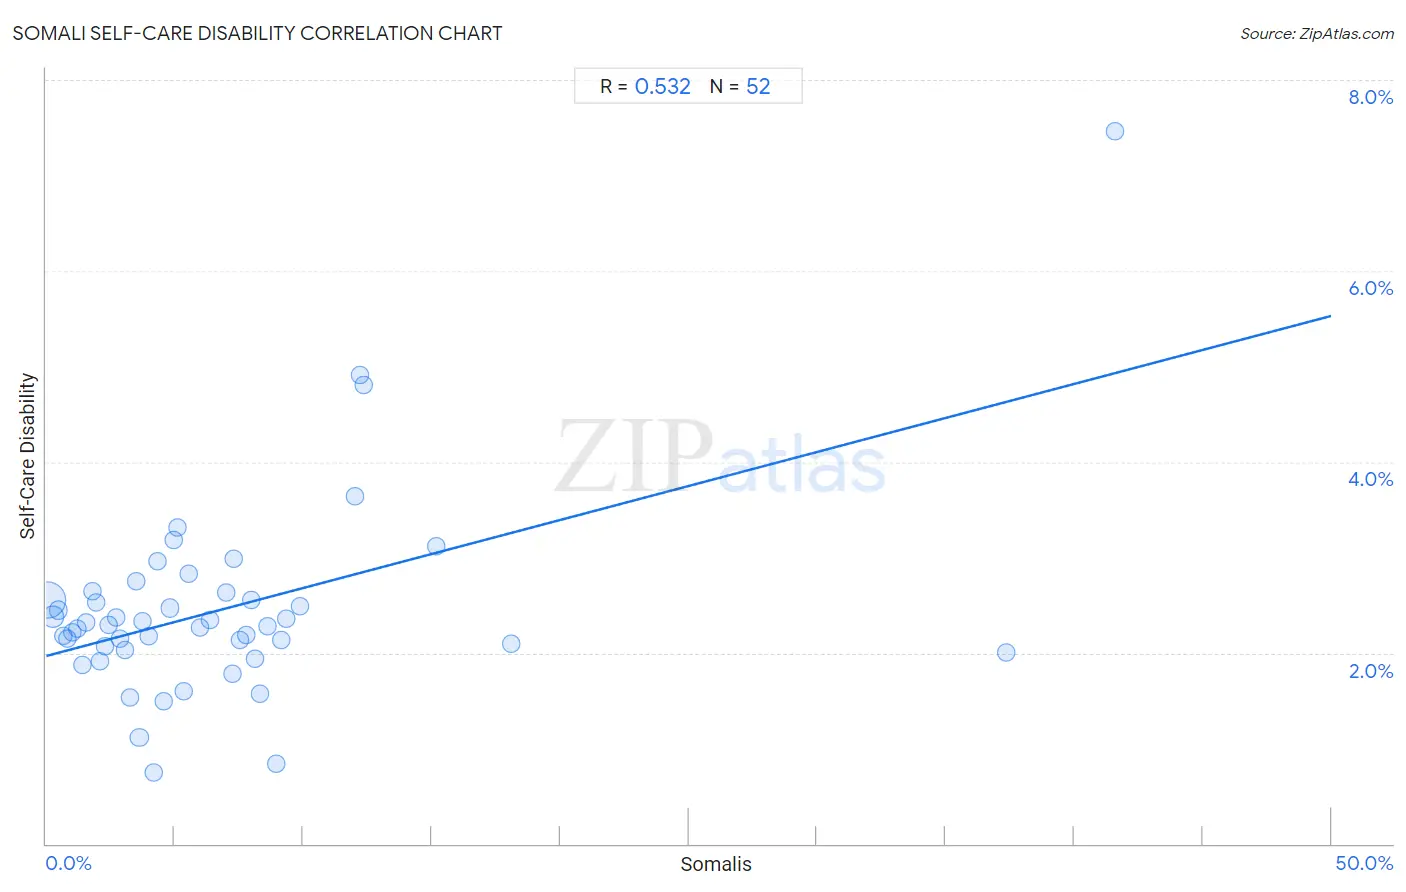
Somali Self-Care Disability Correlation Chart

The statistical analysis conducted on geographies consisting of 99,258,512 people shows a substantial positive correlation between the proportion of Somalis and percentage of population with self-care disability in the United States with a correlation coefficient (R) of 0.532 and weighted average of 2.5%. On average, for every 1% (one percent) increase in Somalis within a typical geography, there is an increase of 0.071% in percentage of population with self-care disability.
Somali Self-Care Disability
It is essential to understand that the correlation between the percentage of Somalis and percentage of population with self-care disability does not imply a direct cause-and-effect relationship. It remains uncertain whether the presence of Somalis influences an upward or downward trend in the level of percentage of population with self-care disability within an area, or if Somalis simply ended up residing in those areas with higher or lower levels of percentage of population with self-care disability due to other factors.

Demographics Similar to Somalis by Self-Care Disability

In terms of self-care disability, the demographic groups most similar to Somalis are German Russian (2.5%, a difference of 0.050%), Lebanese (2.4%, a difference of 0.14%), Finnish (2.4%, a difference of 0.17%), Immigrants from Vietnam (2.5%, a difference of 0.23%), and Syrian (2.5%, a difference of 0.24%).
DemographicsRating | RankSelf-Care Disability
Pakistanis
71.4
/100
|
#155
Good
2.4%
Nigerians
70.6
/100
|
#156
Good
2.4%
Immigrants from Europe
69.6
/100
|
#157
Good
2.4%
Immigrants from Western Europe
68.6
/100
|
#158
Good
2.4%
Immigrants from Italy
68.5
/100
|
#159
Good
2.4%
Finns
67.0
/100
|
#160
Good
2.4%
Lebanese
66.5
/100
|
#161
Good
2.4%
Somalis
63.7
/100
|
#162
Good
2.5%
German Russians
62.7
/100
|
#163
Good
2.5%
Immigrants from Vietnam
59.3
/100
|
#164
Average
2.5%
Syrians
59.0
/100
|
#165
Average
2.5%
Canadians
58.8
/100
|
#166
Average
2.5%
Immigrants from Greece
57.3
/100
|
#167
Average
2.5%
Ute
57.1
/100
|
#168
Average
2.5%
Immigrants from Somalia
55.9
/100
|
#169
Average
2.5%

Somali Self-Care Disability Correlation Summary

MeasurementSomali DataSelf-Care Disability Data
Minimum0.041%0.74%
Maximum41.6%7.5%
Range41.5%6.7%
Mean6.8%2.4%
Median4.9%2.3%
Interquartile 25% (IQ1)2.4%2.0%
Interquartile 75% (IQ3)8.2%2.6%
Interquartile Range (IQR)5.8%0.54%
Standard Deviation (Sample)7.7%1.0%
Standard Deviation (Population)7.6%1.0%

Correlation Details

Somali PercentileSample SizeSelf-Care Disability
[
0.0%
-
0.5%
]
0.041%
72,697,6692.5%
[
0.0%
-
0.5%
]
0.26%
10,918,5412.4%
[
0.0%
-
0.5%
]
0.47%
3,149,5982.4%
[
0.5%
-
1.0%
]
0.66%
3,140,8442.2%
[
0.5%
-
1.0%
]
0.82%
1,263,1562.1%
[
1.0%
-
1.5%
]
1.04%
1,007,7682.2%
[
1.0%
-
1.5%
]
1.20%
1,110,2502.2%
[
1.0%
-
1.5%
]
1.40%
451,0401.9%
[
1.5%
-
2.0%
]
1.57%
659,2552.3%
[
1.5%
-
2.0%
]
1.78%
187,0132.6%
[
1.5%
-
2.0%
]
1.95%
580,4212.5%
[
2.0%
-
2.5%
]
2.11%
248,6361.9%
[
2.0%
-
2.5%
]
2.28%
145,7842.1%
[
2.0%
-
2.5%
]
2.44%
970,2752.3%
[
2.5%
-
3.0%
]
2.72%
220,1292.4%
[
2.5%
-
3.0%
]
2.86%
236,6612.1%
[
3.0%
-
3.5%
]
3.06%
186,8122.0%
[
3.0%
-
3.5%
]
3.24%
143,5121.5%
[
3.5%
-
4.0%
]
3.51%
172,8402.8%
[
3.5%
-
4.0%
]
3.62%
104,9161.1%
[
3.5%
-
4.0%
]
3.74%
17,6412.3%
[
3.5%
-
4.0%
]
3.99%
205,6582.2%
[
4.0%
-
4.5%
]
4.17%
3,5480.74%
[
4.0%
-
4.5%
]
4.33%
54,0283.0%
[
4.5%
-
5.0%
]
4.58%
21,5691.5%
[
4.5%
-
5.0%
]
4.80%
510,5562.5%
[
4.5%
-
5.0%
]
4.95%
122,9653.2%
[
5.0%
-
5.5%
]
5.11%
17,5323.3%
[
5.0%
-
5.5%
]
5.36%
30,6411.6%
[
5.5%
-
6.0%
]
5.57%
88,7682.8%
[
5.5%
-
6.0%
]
5.97%
23,4332.3%
[
6.0%
-
6.5%
]
6.37%
68,9102.3%
[
7.0%
-
7.5%
]
7.01%
67,9992.6%
[
7.0%
-
7.5%
]
7.23%
42,5811.8%
[
7.0%
-
7.5%
]
7.31%
26,7603.0%
[
7.5%
-
8.0%
]
7.53%
32,6812.1%
[
7.5%
-
8.0%
]
7.77%
30,9732.2%
[
7.5%
-
8.0%
]
7.98%
61,4232.6%
[
8.0%
-
8.5%
]
8.11%
13,9561.9%
[
8.0%
-
8.5%
]
8.30%
24,0671.6%
[
8.5%
-
9.0%
]
8.63%
22,8272.3%
[
8.5%
-
9.0%
]
8.95%
14,7590.83%
[
9.0%
-
9.5%
]
9.13%
23,1102.1%
[
9.0%
-
9.5%
]
9.36%
5,9842.4%
[
9.5%
-
10.0%
]
9.85%
24,4182.5%
[
12.0%
-
12.5%
]
12.03%
32,1363.6%
[
12.0%
-
12.5%
]
12.22%
30,6254.9%
[
12.0%
-
12.5%
]
12.34%
28,1724.8%
[
15.0%
-
15.5%
]
15.16%
3,6933.1%
[
18.0%
-
18.5%
]
18.08%
1,9302.1%
[
37.0%
-
37.5%
]
37.34%
1,1572.0%
[
41.5%
-
42.0%
]
41.59%
8,8927.5%