Immigrants from Peru Self-Care Disability
COMPARE
Immigrants from Peru
Select to Compare
Self-Care Disability
Immigrants from Peru Self-Care Disability
2.4%
SELF-CARE DISABILITY
83.2/ 100
METRIC RATING
142nd/ 347
METRIC RANK
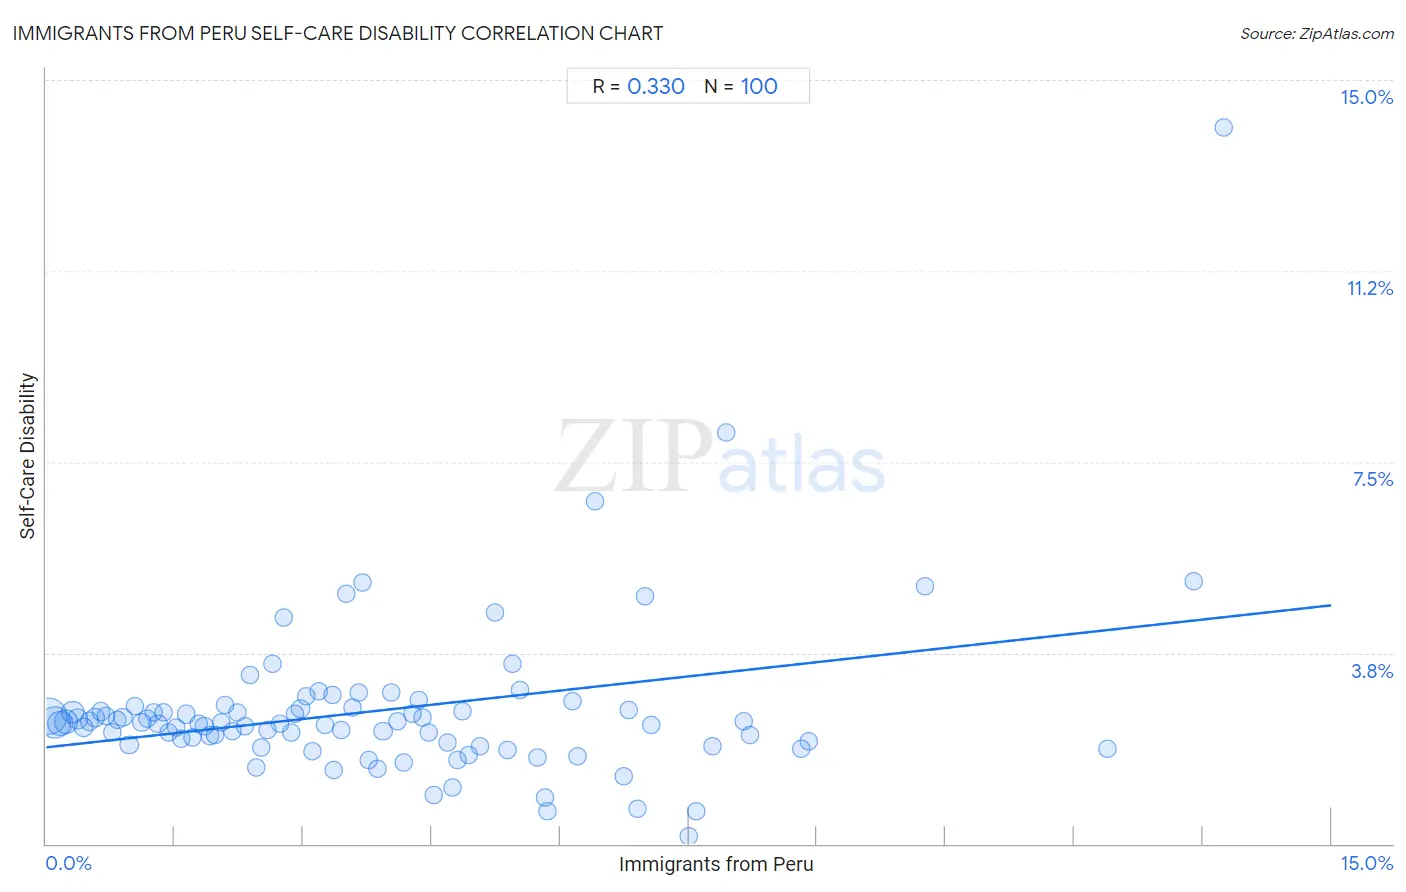
Immigrants from Peru Self-Care Disability Correlation Chart
The statistical analysis conducted on geographies consisting of 328,636,669 people shows a mild positive correlation between the proportion of Immigrants from Peru and percentage of population with self-care disability in the United States with a correlation coefficient (R) of 0.330 and weighted average of 2.4%. On average, for every 1% (one percent) increase in Immigrants from Peru within a typical geography, there is an increase of 0.19% in percentage of population with self-care disability.
It is essential to understand that the correlation between the percentage of Immigrants from Peru and percentage of population with self-care disability does not imply a direct cause-and-effect relationship. It remains uncertain whether the presence of Immigrants from Peru influences an upward or downward trend in the level of percentage of population with self-care disability within an area, or if Immigrants from Peru simply ended up residing in those areas with higher or lower levels of percentage of population with self-care disability due to other factors.
Demographics Similar to Immigrants from Peru by Self-Care Disability
In terms of self-care disability, the demographic groups most similar to Immigrants from Peru are Afghan (2.4%, a difference of 0.080%), Alaska Native (2.4%, a difference of 0.12%), Immigrants from Uruguay (2.4%, a difference of 0.20%), Costa Rican (2.4%, a difference of 0.20%), and German (2.4%, a difference of 0.25%).
| Demographics | Rating | Rank | Self-Care Disability |
| Laotians | 87.8 /100 | #135 | Excellent 2.4% |
| South American Indians | 87.2 /100 | #136 | Excellent 2.4% |
| Austrians | 87.0 /100 | #137 | Excellent 2.4% |
| Immigrants from Croatia | 86.6 /100 | #138 | Excellent 2.4% |
| Sri Lankans | 86.6 /100 | #139 | Excellent 2.4% |
| Immigrants from Uruguay | 85.4 /100 | #140 | Excellent 2.4% |
| Alaska Natives | 84.5 /100 | #141 | Excellent 2.4% |
| Immigrants from Peru | 83.2 /100 | #142 | Excellent 2.4% |
| Afghans | 82.3 /100 | #143 | Excellent 2.4% |
| Costa Ricans | 80.8 /100 | #144 | Excellent 2.4% |
| Germans | 80.1 /100 | #145 | Excellent 2.4% |
| Israelis | 80.0 /100 | #146 | Good 2.4% |
| Dutch | 77.5 /100 | #147 | Good 2.4% |
| Romanians | 75.8 /100 | #148 | Good 2.4% |
| Arabs | 75.7 /100 | #149 | Good 2.4% |
Immigrants from Peru Self-Care Disability Correlation Summary
| Measurement | Immigrants from Peru Data | Self-Care Disability Data |
| Minimum | 0.036% | 0.14% |
| Maximum | 13.7% | 14.1% |
| Range | 13.7% | 13.9% |
| Mean | 3.9% | 2.6% |
| Median | 3.4% | 2.4% |
| Interquartile 25% (IQ1) | 1.7% | 2.0% |
| Interquartile 75% (IQ3) | 5.4% | 2.6% |
| Interquartile Range (IQR) | 3.7% | 0.67% |
| Standard Deviation (Sample) | 2.9% | 1.6% |
| Standard Deviation (Population) | 2.9% | 1.6% |
Correlation Details
| Immigrants from Peru Percentile | Sample Size | Self-Care Disability |
[ 0.0% - 0.5% ] 0.036% | 101,623,519 | 2.5% |
[ 0.0% - 0.5% ] 0.097% | 75,106,132 | 2.4% |
[ 0.0% - 0.5% ] 0.17% | 37,292,147 | 2.4% |
[ 0.0% - 0.5% ] 0.23% | 28,625,370 | 2.4% |
[ 0.0% - 0.5% ] 0.31% | 23,859,988 | 2.6% |
[ 0.0% - 0.5% ] 0.37% | 11,583,254 | 2.5% |
[ 0.0% - 0.5% ] 0.44% | 8,810,727 | 2.3% |
[ 0.5% - 1.0% ] 0.50% | 6,173,770 | 2.4% |
[ 0.5% - 1.0% ] 0.57% | 5,318,623 | 2.5% |
[ 0.5% - 1.0% ] 0.64% | 3,621,485 | 2.6% |
[ 0.5% - 1.0% ] 0.70% | 2,996,068 | 2.5% |
[ 0.5% - 1.0% ] 0.77% | 1,801,511 | 2.2% |
[ 0.5% - 1.0% ] 0.83% | 1,704,024 | 2.4% |
[ 0.5% - 1.0% ] 0.90% | 2,534,127 | 2.5% |
[ 0.5% - 1.0% ] 0.97% | 1,488,929 | 1.9% |
[ 1.0% - 1.5% ] 1.04% | 1,249,776 | 2.7% |
[ 1.0% - 1.5% ] 1.12% | 1,064,583 | 2.4% |
[ 1.0% - 1.5% ] 1.18% | 1,203,031 | 2.5% |
[ 1.0% - 1.5% ] 1.25% | 1,247,312 | 2.6% |
[ 1.0% - 1.5% ] 1.31% | 653,210 | 2.4% |
[ 1.0% - 1.5% ] 1.37% | 1,376,560 | 2.6% |
[ 1.0% - 1.5% ] 1.43% | 610,489 | 2.2% |
[ 1.5% - 2.0% ] 1.51% | 672,290 | 2.3% |
[ 1.5% - 2.0% ] 1.58% | 635,450 | 2.1% |
[ 1.5% - 2.0% ] 1.64% | 556,083 | 2.5% |
[ 1.5% - 2.0% ] 1.71% | 492,062 | 2.1% |
[ 1.5% - 2.0% ] 1.78% | 508,504 | 2.4% |
[ 1.5% - 2.0% ] 1.85% | 617,885 | 2.3% |
[ 1.5% - 2.0% ] 1.91% | 458,638 | 2.1% |
[ 1.5% - 2.0% ] 1.97% | 310,333 | 2.1% |
[ 2.0% - 2.5% ] 2.04% | 250,525 | 2.4% |
[ 2.0% - 2.5% ] 2.08% | 267,070 | 2.7% |
[ 2.0% - 2.5% ] 2.18% | 368,706 | 2.2% |
[ 2.0% - 2.5% ] 2.24% | 421,774 | 2.6% |
[ 2.0% - 2.5% ] 2.32% | 201,988 | 2.3% |
[ 2.0% - 2.5% ] 2.38% | 190,419 | 3.3% |
[ 2.0% - 2.5% ] 2.45% | 67,258 | 1.5% |
[ 2.5% - 3.0% ] 2.51% | 201,498 | 1.9% |
[ 2.5% - 3.0% ] 2.58% | 38,080 | 2.2% |
[ 2.5% - 3.0% ] 2.64% | 228,829 | 3.5% |
[ 2.5% - 3.0% ] 2.73% | 299,413 | 2.4% |
[ 2.5% - 3.0% ] 2.77% | 11,699 | 4.4% |
[ 2.5% - 3.0% ] 2.86% | 66,752 | 2.2% |
[ 2.5% - 3.0% ] 2.91% | 94,252 | 2.6% |
[ 2.5% - 3.0% ] 2.97% | 239,202 | 2.6% |
[ 3.0% - 3.5% ] 3.04% | 155,207 | 2.9% |
[ 3.0% - 3.5% ] 3.11% | 12,264 | 1.8% |
[ 3.0% - 3.5% ] 3.18% | 125,057 | 3.0% |
[ 3.0% - 3.5% ] 3.26% | 48,470 | 2.3% |
[ 3.0% - 3.5% ] 3.34% | 4,098 | 2.9% |
[ 3.0% - 3.5% ] 3.36% | 19,482 | 1.5% |
[ 3.0% - 3.5% ] 3.44% | 88,575 | 2.2% |
[ 3.5% - 4.0% ] 3.50% | 12,071 | 4.9% |
[ 3.5% - 4.0% ] 3.58% | 26,077 | 2.7% |
[ 3.5% - 4.0% ] 3.64% | 2,498 | 3.0% |
[ 3.5% - 4.0% ] 3.69% | 217 | 5.1% |
[ 3.5% - 4.0% ] 3.77% | 41,139 | 1.6% |
[ 3.5% - 4.0% ] 3.86% | 14,570 | 1.5% |
[ 3.5% - 4.0% ] 3.93% | 174,684 | 2.2% |
[ 4.0% - 4.5% ] 4.03% | 794 | 3.0% |
[ 4.0% - 4.5% ] 4.10% | 38,178 | 2.4% |
[ 4.0% - 4.5% ] 4.18% | 16,429 | 1.6% |
[ 4.0% - 4.5% ] 4.27% | 202,257 | 2.6% |
[ 4.0% - 4.5% ] 4.34% | 2,302 | 2.8% |
[ 4.0% - 4.5% ] 4.40% | 15,139 | 2.5% |
[ 4.0% - 4.5% ] 4.46% | 38,163 | 2.2% |
[ 4.5% - 5.0% ] 4.53% | 16,596 | 0.95% |
[ 4.5% - 5.0% ] 4.69% | 43,269 | 2.0% |
[ 4.5% - 5.0% ] 4.74% | 33,691 | 1.1% |
[ 4.5% - 5.0% ] 4.81% | 37,169 | 1.6% |
[ 4.5% - 5.0% ] 4.86% | 7,598 | 2.6% |
[ 4.5% - 5.0% ] 4.93% | 345 | 1.7% |
[ 5.0% - 5.5% ] 5.07% | 25,988 | 1.9% |
[ 5.0% - 5.5% ] 5.24% | 687 | 4.5% |
[ 5.0% - 5.5% ] 5.38% | 2,025 | 1.8% |
[ 5.0% - 5.5% ] 5.44% | 7,185 | 3.5% |
[ 5.5% - 6.0% ] 5.52% | 62,419 | 3.0% |
[ 5.5% - 6.0% ] 5.73% | 20,409 | 1.7% |
[ 5.5% - 6.0% ] 5.82% | 8,104 | 0.90% |
[ 5.5% - 6.0% ] 5.85% | 6,601 | 0.63% |
[ 6.0% - 6.5% ] 6.14% | 2,718 | 2.8% |
[ 6.0% - 6.5% ] 6.20% | 44,394 | 1.7% |
[ 6.0% - 6.5% ] 6.41% | 1,497 | 6.7% |
[ 6.5% - 7.0% ] 6.74% | 11,584 | 1.3% |
[ 6.5% - 7.0% ] 6.79% | 2,929 | 2.6% |
[ 6.5% - 7.0% ] 6.90% | 464 | 0.70% |
[ 6.5% - 7.0% ] 6.99% | 8,373 | 4.9% |
[ 7.0% - 7.5% ] 7.06% | 82,314 | 2.3% |
[ 7.5% - 8.0% ] 7.50% | 2,533 | 0.14% |
[ 7.5% - 8.0% ] 7.58% | 963 | 0.64% |
[ 7.5% - 8.0% ] 7.78% | 681 | 1.9% |
[ 7.5% - 8.0% ] 7.94% | 2,910 | 8.1% |
[ 8.0% - 8.5% ] 8.14% | 467 | 2.4% |
[ 8.0% - 8.5% ] 8.22% | 11,069 | 2.1% |
[ 8.5% - 9.0% ] 8.82% | 5,309 | 1.9% |
[ 8.5% - 9.0% ] 8.90% | 2,101 | 2.0% |
[ 10.0% - 10.5% ] 10.26% | 1,277 | 5.1% |
[ 12.0% - 12.5% ] 12.39% | 1,574 | 1.9% |
[ 13.0% - 13.5% ] 13.40% | 97 | 5.2% |
[ 13.5% - 14.0% ] 13.74% | 313 | 14.1% |