Sri Lankan Self-Care Disability
COMPARE
Sri Lankan
Select to Compare
Self-Care Disability
Sri Lankan Self-Care Disability
2.4%
SELF-CARE DISABILITY
86.6/ 100
METRIC RATING
139th/ 347
METRIC RANK
Sri Lankan Self-Care Disability Correlation Chart
The statistical analysis conducted on geographies consisting of 439,764,256 people shows a mild positive correlation between the proportion of Sri Lankans and percentage of population with self-care disability in the United States with a correlation coefficient (R) of 0.366 and weighted average of 2.4%. On average, for every 1% (one percent) increase in Sri Lankans within a typical geography, there is an increase of 0.034% in percentage of population with self-care disability.
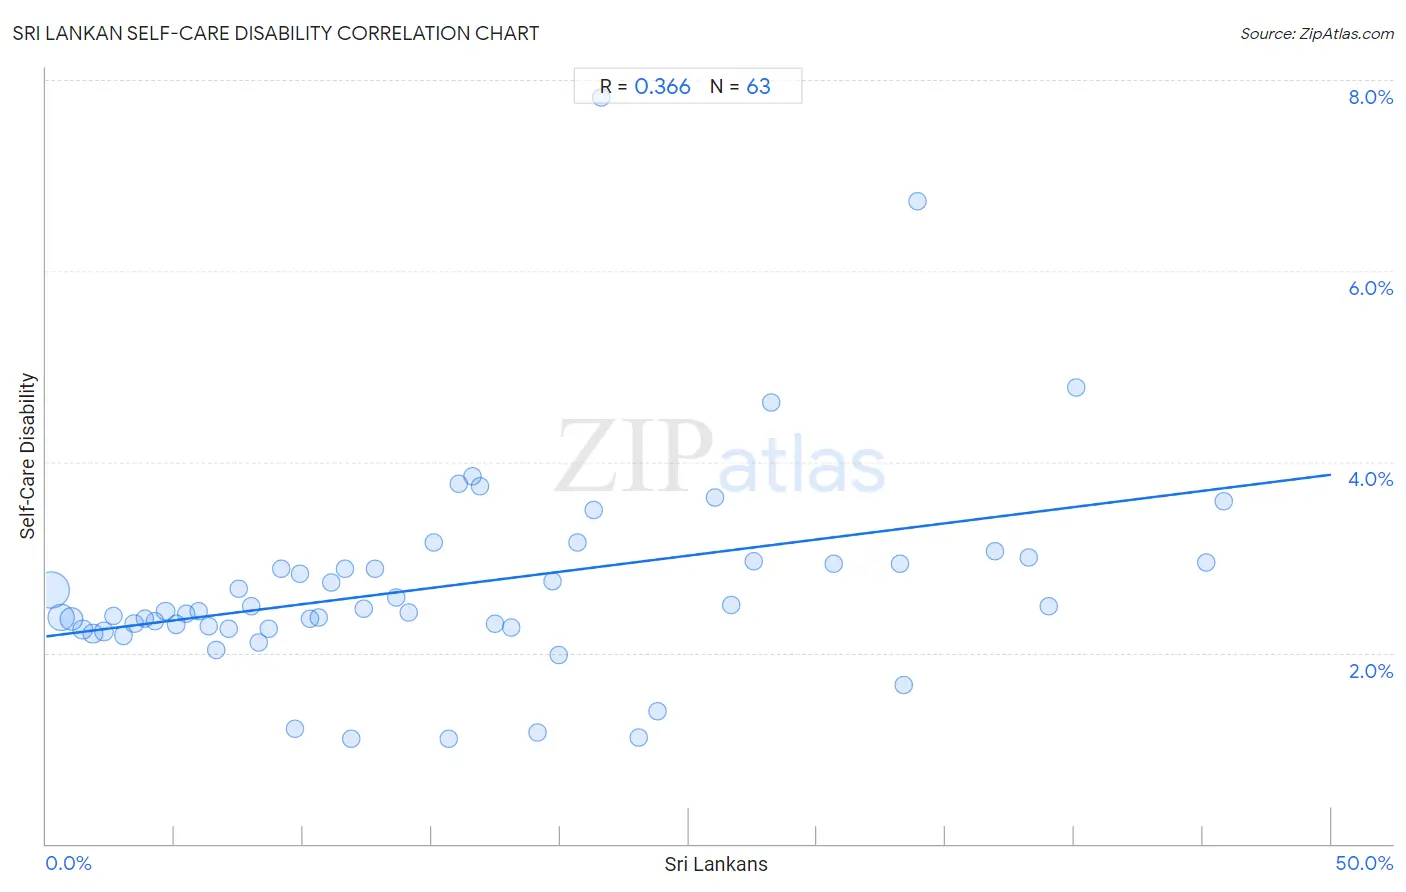
It is essential to understand that the correlation between the percentage of Sri Lankans and percentage of population with self-care disability does not imply a direct cause-and-effect relationship. It remains uncertain whether the presence of Sri Lankans influences an upward or downward trend in the level of percentage of population with self-care disability within an area, or if Sri Lankans simply ended up residing in those areas with higher or lower levels of percentage of population with self-care disability due to other factors.
Demographics Similar to Sri Lankans by Self-Care Disability
In terms of self-care disability, the demographic groups most similar to Sri Lankans are Immigrants from Croatia (2.4%, a difference of 0.0%), Austrian (2.4%, a difference of 0.050%), South American Indian (2.4%, a difference of 0.070%), Immigrants from Uruguay (2.4%, a difference of 0.12%), and Laotian (2.4%, a difference of 0.13%).
| Demographics | Rating | Rank | Self-Care Disability |
| Immigrants from South America | 88.8 /100 | #132 | Excellent 2.4% |
| Immigrants from Colombia | 88.5 /100 | #133 | Excellent 2.4% |
| Russians | 88.2 /100 | #134 | Excellent 2.4% |
| Laotians | 87.8 /100 | #135 | Excellent 2.4% |
| South American Indians | 87.2 /100 | #136 | Excellent 2.4% |
| Austrians | 87.0 /100 | #137 | Excellent 2.4% |
| Immigrants from Croatia | 86.6 /100 | #138 | Excellent 2.4% |
| Sri Lankans | 86.6 /100 | #139 | Excellent 2.4% |
| Immigrants from Uruguay | 85.4 /100 | #140 | Excellent 2.4% |
| Alaska Natives | 84.5 /100 | #141 | Excellent 2.4% |
| Immigrants from Peru | 83.2 /100 | #142 | Excellent 2.4% |
| Afghans | 82.3 /100 | #143 | Excellent 2.4% |
| Costa Ricans | 80.8 /100 | #144 | Excellent 2.4% |
| Germans | 80.1 /100 | #145 | Excellent 2.4% |
| Israelis | 80.0 /100 | #146 | Good 2.4% |
Sri Lankan Self-Care Disability Correlation Summary
| Measurement | Sri Lankan Data | Self-Care Disability Data |
| Minimum | 0.18% | 1.1% |
| Maximum | 45.8% | 7.8% |
| Range | 45.6% | 6.7% |
| Mean | 15.9% | 2.7% |
| Median | 12.8% | 2.4% |
| Interquartile 25% (IQ1) | 6.3% | 2.3% |
| Interquartile 75% (IQ3) | 23.1% | 2.9% |
| Interquartile Range (IQR) | 16.7% | 0.68% |
| Standard Deviation (Sample) | 12.1% | 1.1% |
| Standard Deviation (Population) | 12.0% | 1.1% |
Correlation Details
| Sri Lankan Percentile | Sample Size | Self-Care Disability |
[ 0.0% - 0.5% ] 0.18% | 206,727,750 | 2.7% |
[ 0.5% - 1.0% ] 0.57% | 98,642,704 | 2.4% |
[ 0.5% - 1.0% ] 0.98% | 50,685,230 | 2.4% |
[ 1.0% - 1.5% ] 1.40% | 23,046,144 | 2.2% |
[ 1.5% - 2.0% ] 1.82% | 16,874,974 | 2.2% |
[ 2.0% - 2.5% ] 2.23% | 9,877,077 | 2.2% |
[ 2.5% - 3.0% ] 2.61% | 7,276,310 | 2.4% |
[ 2.5% - 3.0% ] 2.99% | 6,021,432 | 2.2% |
[ 3.0% - 3.5% ] 3.42% | 3,174,980 | 2.3% |
[ 3.5% - 4.0% ] 3.83% | 2,980,381 | 2.4% |
[ 4.0% - 4.5% ] 4.23% | 2,034,734 | 2.3% |
[ 4.5% - 5.0% ] 4.64% | 1,461,993 | 2.4% |
[ 5.0% - 5.5% ] 5.06% | 1,662,620 | 2.3% |
[ 5.0% - 5.5% ] 5.45% | 546,500 | 2.4% |
[ 5.5% - 6.0% ] 5.93% | 1,543,264 | 2.4% |
[ 6.0% - 6.5% ] 6.32% | 440,564 | 2.3% |
[ 6.5% - 7.0% ] 6.62% | 507,041 | 2.0% |
[ 7.0% - 7.5% ] 7.09% | 469,242 | 2.3% |
[ 7.0% - 7.5% ] 7.49% | 348,611 | 2.7% |
[ 7.5% - 8.0% ] 7.98% | 467,585 | 2.5% |
[ 8.0% - 8.5% ] 8.26% | 327,736 | 2.1% |
[ 8.5% - 9.0% ] 8.64% | 261,069 | 2.3% |
[ 9.0% - 9.5% ] 9.13% | 462,954 | 2.9% |
[ 9.5% - 10.0% ] 9.66% | 35,664 | 1.2% |
[ 9.5% - 10.0% ] 9.89% | 162,424 | 2.8% |
[ 10.0% - 10.5% ] 10.28% | 189,042 | 2.4% |
[ 10.5% - 11.0% ] 10.59% | 138,034 | 2.4% |
[ 11.0% - 11.5% ] 11.09% | 252,540 | 2.7% |
[ 11.5% - 12.0% ] 11.62% | 170,485 | 2.9% |
[ 11.5% - 12.0% ] 11.89% | 3,710 | 1.1% |
[ 12.0% - 12.5% ] 12.33% | 1,095,174 | 2.5% |
[ 12.5% - 13.0% ] 12.78% | 114,382 | 2.9% |
[ 13.5% - 14.0% ] 13.63% | 243,185 | 2.6% |
[ 14.0% - 14.5% ] 14.12% | 221,988 | 2.4% |
[ 15.0% - 15.5% ] 15.09% | 13,719 | 3.2% |
[ 15.5% - 16.0% ] 15.65% | 27,827 | 1.1% |
[ 16.0% - 16.5% ] 16.03% | 62,929 | 3.8% |
[ 16.5% - 17.0% ] 16.59% | 211 | 3.8% |
[ 16.5% - 17.0% ] 16.90% | 28,576 | 3.7% |
[ 17.0% - 17.5% ] 17.44% | 51,043 | 2.3% |
[ 18.0% - 18.5% ] 18.08% | 78,830 | 2.3% |
[ 19.0% - 19.5% ] 19.13% | 2,661 | 1.2% |
[ 19.5% - 20.0% ] 19.68% | 59,851 | 2.8% |
[ 19.5% - 20.0% ] 19.96% | 96,079 | 2.0% |
[ 20.5% - 21.0% ] 20.69% | 7,786 | 3.2% |
[ 21.0% - 21.5% ] 21.31% | 52,555 | 3.5% |
[ 21.5% - 22.0% ] 21.59% | 1,575 | 7.8% |
[ 23.0% - 23.5% ] 23.05% | 859 | 1.1% |
[ 23.5% - 24.0% ] 23.79% | 1,753 | 1.4% |
[ 26.0% - 26.5% ] 26.04% | 9,832 | 3.6% |
[ 26.5% - 27.0% ] 26.64% | 183,583 | 2.5% |
[ 27.5% - 28.0% ] 27.51% | 53,826 | 3.0% |
[ 28.0% - 28.5% ] 28.22% | 6,563 | 4.6% |
[ 30.5% - 31.0% ] 30.64% | 45,688 | 2.9% |
[ 33.0% - 33.5% ] 33.20% | 171,637 | 2.9% |
[ 33.0% - 33.5% ] 33.39% | 593 | 1.7% |
[ 33.5% - 34.0% ] 33.92% | 401 | 6.7% |
[ 36.5% - 37.0% ] 36.91% | 36,657 | 3.1% |
[ 38.0% - 38.5% ] 38.21% | 34,188 | 3.0% |
[ 39.0% - 39.5% ] 39.02% | 47,549 | 2.5% |
[ 40.0% - 40.5% ] 40.07% | 16,072 | 4.8% |
[ 45.0% - 45.5% ] 45.14% | 181,268 | 2.9% |
[ 45.5% - 46.0% ] 45.82% | 22,622 | 3.6% |