Bangladeshi Self-Care Disability
COMPARE
Bangladeshi
Select to Compare
Self-Care Disability
Bangladeshi Self-Care Disability
2.8%
SELF-CARE DISABILITY
0.0/ 100
METRIC RATING
309th/ 347
METRIC RANK
Bangladeshi Self-Care Disability Correlation Chart
The statistical analysis conducted on geographies consisting of 141,272,770 people shows a mild positive correlation between the proportion of Bangladeshis and percentage of population with self-care disability in the United States with a correlation coefficient (R) of 0.338 and weighted average of 2.8%. On average, for every 1% (one percent) increase in Bangladeshis within a typical geography, there is an increase of 0.048% in percentage of population with self-care disability.
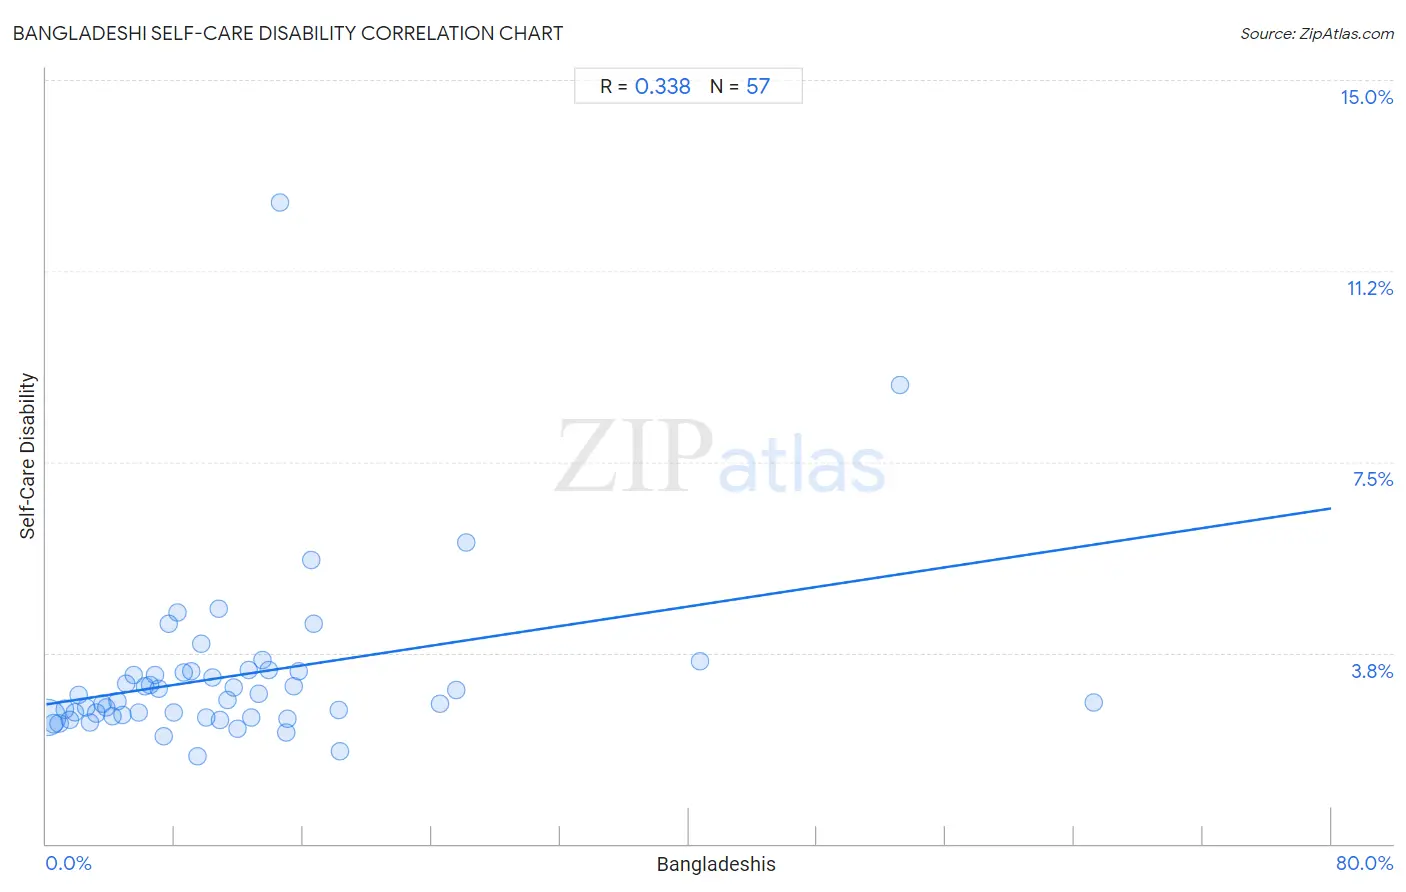
It is essential to understand that the correlation between the percentage of Bangladeshis and percentage of population with self-care disability does not imply a direct cause-and-effect relationship. It remains uncertain whether the presence of Bangladeshis influences an upward or downward trend in the level of percentage of population with self-care disability within an area, or if Bangladeshis simply ended up residing in those areas with higher or lower levels of percentage of population with self-care disability due to other factors.
Demographics Similar to Bangladeshis by Self-Care Disability
In terms of self-care disability, the demographic groups most similar to Bangladeshis are British West Indian (2.8%, a difference of 0.10%), Immigrants from Grenada (2.8%, a difference of 0.15%), Puget Sound Salish (2.8%, a difference of 0.17%), Immigrants from Caribbean (2.8%, a difference of 0.36%), and Spanish American (2.8%, a difference of 0.40%).
| Demographics | Rating | Rank | Self-Care Disability |
| Immigrants from St. Vincent and the Grenadines | 0.0 /100 | #302 | Tragic 2.8% |
| Immigrants from Belize | 0.0 /100 | #303 | Tragic 2.8% |
| Cree | 0.0 /100 | #304 | Tragic 2.8% |
| Immigrants from West Indies | 0.0 /100 | #305 | Tragic 2.8% |
| Aleuts | 0.0 /100 | #306 | Tragic 2.8% |
| Natives/Alaskans | 0.0 /100 | #307 | Tragic 2.8% |
| Immigrants from Grenada | 0.0 /100 | #308 | Tragic 2.8% |
| Bangladeshis | 0.0 /100 | #309 | Tragic 2.8% |
| British West Indians | 0.0 /100 | #310 | Tragic 2.8% |
| Puget Sound Salish | 0.0 /100 | #311 | Tragic 2.8% |
| Immigrants from Caribbean | 0.0 /100 | #312 | Tragic 2.8% |
| Spanish Americans | 0.0 /100 | #313 | Tragic 2.8% |
| Creek | 0.0 /100 | #314 | Tragic 2.8% |
| Immigrants from Cuba | 0.0 /100 | #315 | Tragic 2.8% |
| Menominee | 0.0 /100 | #316 | Tragic 2.8% |
Bangladeshi Self-Care Disability Correlation Summary
| Measurement | Bangladeshi Data | Self-Care Disability Data |
| Minimum | 0.061% | 1.7% |
| Maximum | 65.2% | 12.6% |
| Range | 65.2% | 10.9% |
| Mean | 11.8% | 3.3% |
| Median | 9.4% | 2.8% |
| Interquartile 25% (IQ1) | 4.6% | 2.5% |
| Interquartile 75% (IQ3) | 14.7% | 3.4% |
| Interquartile Range (IQR) | 10.1% | 0.90% |
| Standard Deviation (Sample) | 11.8% | 1.7% |
| Standard Deviation (Population) | 11.7% | 1.7% |
Correlation Details
| Bangladeshi Percentile | Sample Size | Self-Care Disability |
[ 0.0% - 0.5% ] 0.061% | 114,818,675 | 2.5% |
[ 0.0% - 0.5% ] 0.45% | 8,715,880 | 2.4% |
[ 0.5% - 1.0% ] 0.80% | 3,546,926 | 2.4% |
[ 1.0% - 1.5% ] 1.16% | 1,841,419 | 2.6% |
[ 1.0% - 1.5% ] 1.45% | 1,959,099 | 2.4% |
[ 1.5% - 2.0% ] 1.75% | 2,129,431 | 2.6% |
[ 2.0% - 2.5% ] 2.04% | 1,196,311 | 2.9% |
[ 2.0% - 2.5% ] 2.47% | 721,978 | 2.7% |
[ 2.5% - 3.0% ] 2.73% | 624,931 | 2.4% |
[ 3.0% - 3.5% ] 3.13% | 471,590 | 2.6% |
[ 3.0% - 3.5% ] 3.47% | 936,270 | 2.7% |
[ 3.5% - 4.0% ] 3.73% | 328,098 | 2.7% |
[ 4.0% - 4.5% ] 4.10% | 538,756 | 2.5% |
[ 4.0% - 4.5% ] 4.42% | 290,997 | 2.8% |
[ 4.5% - 5.0% ] 4.76% | 30,701 | 2.5% |
[ 4.5% - 5.0% ] 4.98% | 761,348 | 3.1% |
[ 5.0% - 5.5% ] 5.48% | 167,360 | 3.3% |
[ 5.5% - 6.0% ] 5.77% | 107,730 | 2.6% |
[ 6.0% - 6.5% ] 6.12% | 174,810 | 3.1% |
[ 6.0% - 6.5% ] 6.44% | 63,612 | 3.1% |
[ 6.5% - 7.0% ] 6.76% | 170,696 | 3.3% |
[ 6.5% - 7.0% ] 6.99% | 50,484 | 3.0% |
[ 7.0% - 7.5% ] 7.32% | 10,557 | 2.1% |
[ 7.5% - 8.0% ] 7.66% | 37,988 | 4.3% |
[ 7.5% - 8.0% ] 7.92% | 42,735 | 2.6% |
[ 8.0% - 8.5% ] 8.18% | 52,886 | 4.5% |
[ 8.5% - 9.0% ] 8.55% | 12,684 | 3.4% |
[ 9.0% - 9.5% ] 9.03% | 148,369 | 3.4% |
[ 9.0% - 9.5% ] 9.40% | 51,109 | 1.7% |
[ 9.5% - 10.0% ] 9.63% | 135,082 | 3.9% |
[ 9.5% - 10.0% ] 9.96% | 134,205 | 2.5% |
[ 10.0% - 10.5% ] 10.33% | 64,531 | 3.3% |
[ 10.5% - 11.0% ] 10.72% | 70,827 | 4.6% |
[ 10.5% - 11.0% ] 10.85% | 31,292 | 2.4% |
[ 11.0% - 11.5% ] 11.27% | 308,806 | 2.8% |
[ 11.5% - 12.0% ] 11.69% | 1,172 | 3.1% |
[ 11.5% - 12.0% ] 11.89% | 32,912 | 2.3% |
[ 12.5% - 13.0% ] 12.59% | 2,208 | 3.4% |
[ 12.5% - 13.0% ] 12.76% | 84,951 | 2.5% |
[ 13.0% - 13.5% ] 13.26% | 2,006 | 3.0% |
[ 13.0% - 13.5% ] 13.48% | 13,459 | 3.6% |
[ 13.5% - 14.0% ] 13.86% | 95,310 | 3.4% |
[ 14.5% - 15.0% ] 14.53% | 296 | 12.6% |
[ 14.5% - 15.0% ] 14.91% | 932 | 2.2% |
[ 15.0% - 15.5% ] 15.04% | 13,116 | 2.5% |
[ 15.0% - 15.5% ] 15.39% | 132,092 | 3.1% |
[ 15.5% - 16.0% ] 15.74% | 216 | 3.4% |
[ 16.0% - 16.5% ] 16.48% | 6,790 | 5.6% |
[ 16.5% - 17.0% ] 16.66% | 34,220 | 4.3% |
[ 18.0% - 18.5% ] 18.23% | 7,581 | 2.6% |
[ 18.0% - 18.5% ] 18.31% | 17,716 | 1.8% |
[ 24.5% - 25.0% ] 24.55% | 1,218 | 2.7% |
[ 25.5% - 26.0% ] 25.55% | 57,662 | 3.0% |
[ 26.0% - 26.5% ] 26.16% | 19,613 | 5.9% |
[ 40.5% - 41.0% ] 40.74% | 734 | 3.6% |
[ 53.0% - 53.5% ] 53.15% | 111 | 9.0% |
[ 65.0% - 65.5% ] 65.25% | 282 | 2.8% |