Scotch-Irish Births to Unmarried Women
COMPARE
Scotch-Irish
Select to Compare
Births to Unmarried Women
Scotch-Irish Births to Unmarried Women
33.3%
BIRTHS TO UNMARRIED WOMEN
10.7/ 100
METRIC RATING
210th/ 347
METRIC RANK
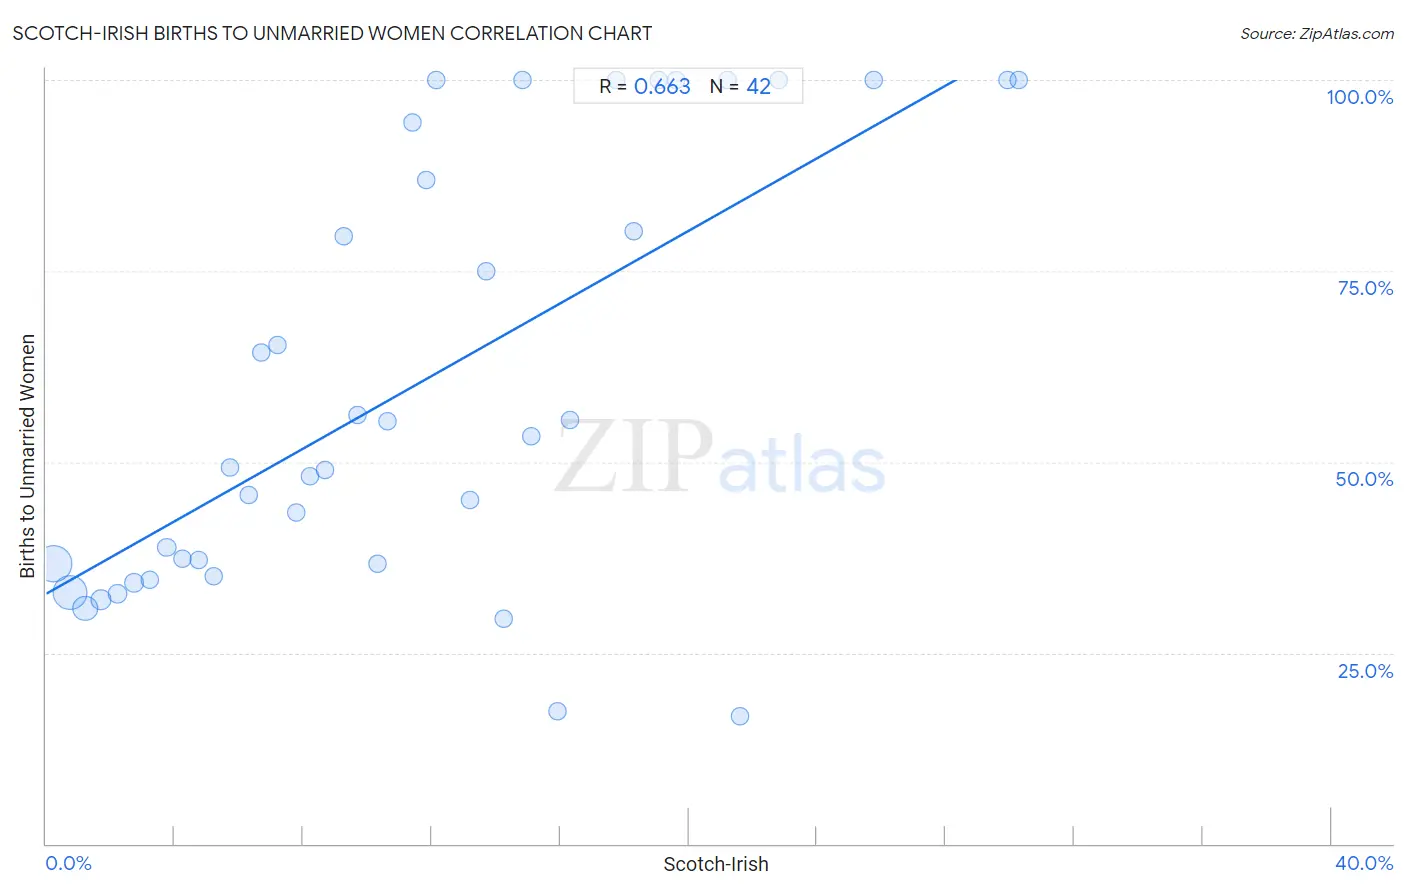
Scotch-Irish Births to Unmarried Women Correlation Chart
The statistical analysis conducted on geographies consisting of 488,755,262 people shows a significant positive correlation between the proportion of Scotch-Irish and percentage of births to unmarried women in the United States with a correlation coefficient (R) of 0.663 and weighted average of 33.3%. On average, for every 1% (one percent) increase in Scotch-Irish within a typical geography, there is an increase of 2.4% in percentage of births to unmarried women.
It is essential to understand that the correlation between the percentage of Scotch-Irish and percentage of births to unmarried women does not imply a direct cause-and-effect relationship. It remains uncertain whether the presence of Scotch-Irish influences an upward or downward trend in the level of percentage of births to unmarried women within an area, or if Scotch-Irish simply ended up residing in those areas with higher or lower levels of percentage of births to unmarried women due to other factors.
Demographics Similar to Scotch-Irish by Births to Unmarried Women
In terms of births to unmarried women, the demographic groups most similar to Scotch-Irish are White/Caucasian (33.3%, a difference of 0.0%), Ecuadorian (33.3%, a difference of 0.050%), Celtic (33.3%, a difference of 0.12%), Hawaiian (33.2%, a difference of 0.14%), and Immigrants from Sudan (33.2%, a difference of 0.17%).
| Demographics | Rating | Rank | Births to Unmarried Women |
| Ute | 14.4 /100 | #203 | Poor 33.0% |
| Immigrants from Africa | 14.3 /100 | #204 | Poor 33.0% |
| German Russians | 13.1 /100 | #205 | Poor 33.1% |
| Uruguayans | 12.8 /100 | #206 | Poor 33.1% |
| Immigrants from Sudan | 11.5 /100 | #207 | Poor 33.2% |
| Hawaiians | 11.3 /100 | #208 | Poor 33.2% |
| Whites/Caucasians | 10.7 /100 | #209 | Poor 33.3% |
| Scotch-Irish | 10.7 /100 | #210 | Poor 33.3% |
| Ecuadorians | 10.5 /100 | #211 | Poor 33.3% |
| Celtics | 10.2 /100 | #212 | Poor 33.3% |
| Immigrants from Costa Rica | 9.5 /100 | #213 | Tragic 33.4% |
| Slovaks | 9.3 /100 | #214 | Tragic 33.4% |
| French | 8.7 /100 | #215 | Tragic 33.4% |
| Nepalese | 7.8 /100 | #216 | Tragic 33.5% |
| Spaniards | 7.0 /100 | #217 | Tragic 33.6% |
Scotch-Irish Births to Unmarried Women Correlation Summary
| Measurement | Scotch-Irish Data | Births to Unmarried Women Data |
| Minimum | 0.25% | 16.7% |
| Maximum | 30.3% | 100.0% |
| Range | 30.0% | 83.3% |
| Mean | 11.6% | 60.2% |
| Median | 10.5% | 51.3% |
| Interquartile 25% (IQ1) | 5.2% | 36.6% |
| Interquartile 75% (IQ3) | 16.3% | 94.4% |
| Interquartile Range (IQR) | 11.1% | 57.8% |
| Standard Deviation (Sample) | 7.9% | 28.1% |
| Standard Deviation (Population) | 7.8% | 27.8% |
Correlation Details
| Scotch-Irish Percentile | Sample Size | Births to Unmarried Women |
[ 0.0% - 0.5% ] 0.25% | 193,205,937 | 36.7% |
[ 0.5% - 1.0% ] 0.72% | 166,245,372 | 32.9% |
[ 1.0% - 1.5% ] 1.20% | 72,076,257 | 30.8% |
[ 1.5% - 2.0% ] 1.71% | 30,719,973 | 31.9% |
[ 2.0% - 2.5% ] 2.21% | 12,553,717 | 32.8% |
[ 2.5% - 3.0% ] 2.73% | 6,024,839 | 34.1% |
[ 3.0% - 3.5% ] 3.23% | 3,855,112 | 34.6% |
[ 3.5% - 4.0% ] 3.75% | 1,873,029 | 38.8% |
[ 4.0% - 4.5% ] 4.26% | 809,202 | 37.3% |
[ 4.5% - 5.0% ] 4.76% | 454,264 | 37.2% |
[ 5.0% - 5.5% ] 5.23% | 412,124 | 35.0% |
[ 5.5% - 6.0% ] 5.71% | 166,965 | 49.3% |
[ 6.0% - 6.5% ] 6.32% | 70,200 | 45.6% |
[ 6.5% - 7.0% ] 6.67% | 48,818 | 64.2% |
[ 7.0% - 7.5% ] 7.21% | 50,076 | 65.4% |
[ 7.5% - 8.0% ] 7.79% | 48,378 | 43.4% |
[ 8.0% - 8.5% ] 8.21% | 23,815 | 48.1% |
[ 8.5% - 9.0% ] 8.70% | 21,688 | 49.0% |
[ 9.0% - 9.5% ] 9.27% | 6,001 | 79.6% |
[ 9.5% - 10.0% ] 9.69% | 4,923 | 56.2% |
[ 10.0% - 10.5% ] 10.30% | 16,171 | 36.6% |
[ 10.5% - 11.0% ] 10.64% | 9,082 | 55.3% |
[ 11.0% - 11.5% ] 11.40% | 4,809 | 94.4% |
[ 11.5% - 12.0% ] 11.81% | 3,776 | 86.8% |
[ 12.0% - 12.5% ] 12.13% | 1,360 | 100.0% |
[ 13.0% - 13.5% ] 13.20% | 11,898 | 45.0% |
[ 13.5% - 14.0% ] 13.71% | 9,326 | 75.0% |
[ 14.0% - 14.5% ] 14.25% | 12,686 | 29.5% |
[ 14.5% - 15.0% ] 14.82% | 803 | 100.0% |
[ 15.0% - 15.5% ] 15.10% | 2,166 | 53.3% |
[ 15.5% - 16.0% ] 15.91% | 3,093 | 17.3% |
[ 16.0% - 16.5% ] 16.30% | 4,920 | 55.5% |
[ 17.5% - 18.0% ] 17.73% | 440 | 100.0% |
[ 18.0% - 18.5% ] 18.30% | 1,525 | 80.2% |
[ 19.0% - 19.5% ] 19.05% | 63 | 100.0% |
[ 19.5% - 20.0% ] 19.61% | 102 | 100.0% |
[ 21.0% - 21.5% ] 21.21% | 363 | 100.0% |
[ 21.5% - 22.0% ] 21.61% | 199 | 16.7% |
[ 22.5% - 23.0% ] 22.81% | 228 | 100.0% |
[ 25.5% - 26.0% ] 25.77% | 163 | 100.0% |
[ 29.5% - 30.0% ] 29.91% | 662 | 100.0% |
[ 30.0% - 30.5% ] 30.26% | 737 | 100.0% |