Assyrian/Chaldean/Syriac Self-Care Disability
COMPARE
Assyrian/Chaldean/Syriac
Select to Compare
Self-Care Disability
Assyrian/Chaldean/Syriac Self-Care Disability
2.8%
SELF-CARE DISABILITY
0.0/ 100
METRIC RATING
318th/ 347
METRIC RANK
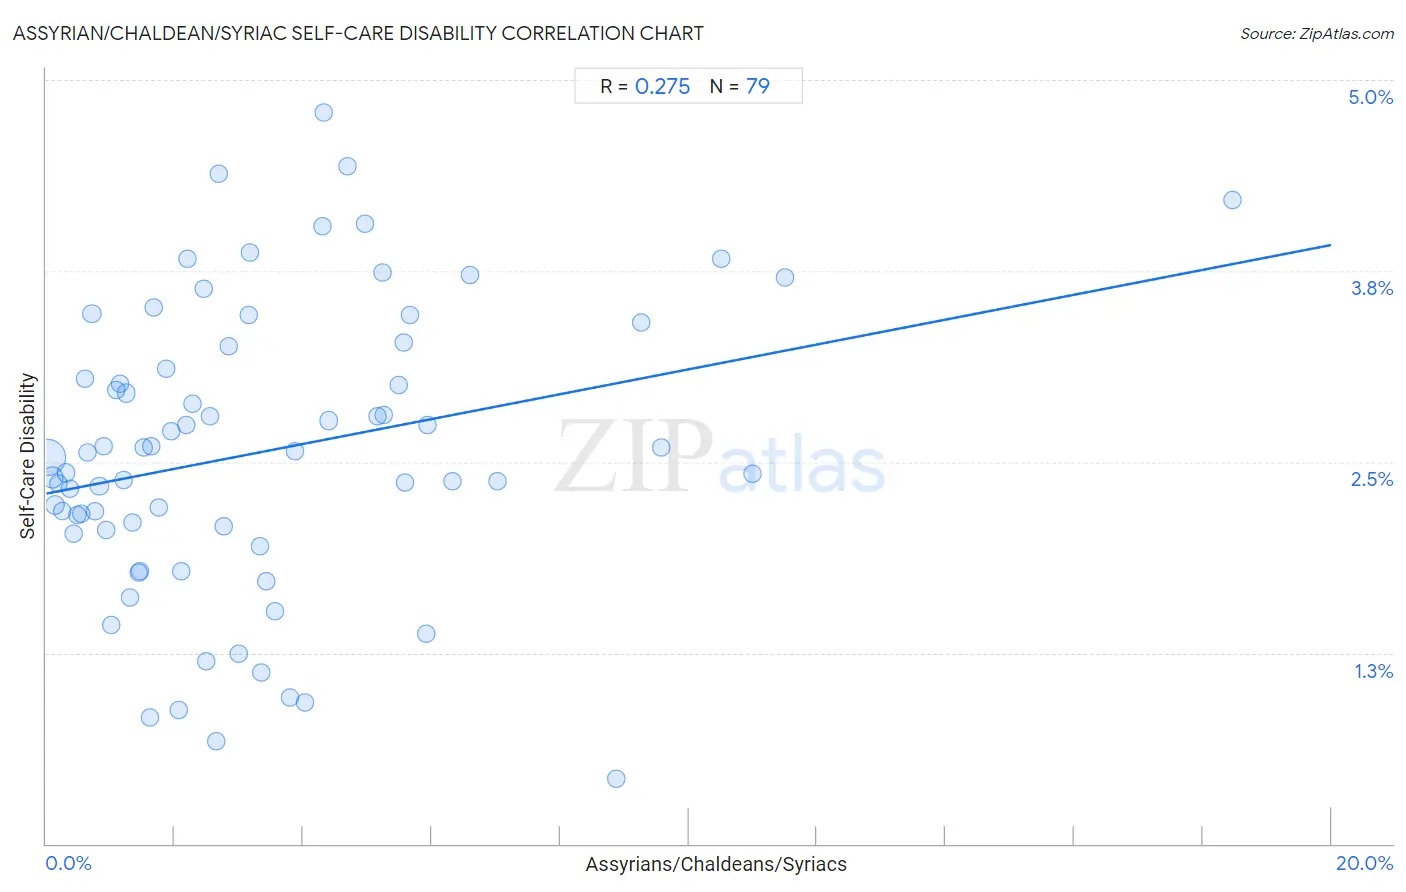
Assyrian/Chaldean/Syriac Self-Care Disability Correlation Chart
The statistical analysis conducted on geographies consisting of 110,250,746 people shows a weak positive correlation between the proportion of Assyrians/Chaldeans/Syriacs and percentage of population with self-care disability in the United States with a correlation coefficient (R) of 0.275 and weighted average of 2.8%. On average, for every 1% (one percent) increase in Assyrians/Chaldeans/Syriacs within a typical geography, there is an increase of 0.081% in percentage of population with self-care disability.
It is essential to understand that the correlation between the percentage of Assyrians/Chaldeans/Syriacs and percentage of population with self-care disability does not imply a direct cause-and-effect relationship. It remains uncertain whether the presence of Assyrians/Chaldeans/Syriacs influences an upward or downward trend in the level of percentage of population with self-care disability within an area, or if Assyrians/Chaldeans/Syriacs simply ended up residing in those areas with higher or lower levels of percentage of population with self-care disability due to other factors.
Demographics Similar to Assyrians/Chaldeans/Syriacs by Self-Care Disability
In terms of self-care disability, the demographic groups most similar to Assyrians/Chaldeans/Syriacs are Immigrants from Dominica (2.8%, a difference of 0.010%), Menominee (2.8%, a difference of 0.14%), Spanish American Indian (2.9%, a difference of 0.16%), Immigrants from Cuba (2.8%, a difference of 0.24%), and Chickasaw (2.9%, a difference of 0.37%).
| Demographics | Rating | Rank | Self-Care Disability |
| Puget Sound Salish | 0.0 /100 | #311 | Tragic 2.8% |
| Immigrants from Caribbean | 0.0 /100 | #312 | Tragic 2.8% |
| Spanish Americans | 0.0 /100 | #313 | Tragic 2.8% |
| Creek | 0.0 /100 | #314 | Tragic 2.8% |
| Immigrants from Cuba | 0.0 /100 | #315 | Tragic 2.8% |
| Menominee | 0.0 /100 | #316 | Tragic 2.8% |
| Immigrants from Dominica | 0.0 /100 | #317 | Tragic 2.8% |
| Assyrians/Chaldeans/Syriacs | 0.0 /100 | #318 | Tragic 2.8% |
| Spanish American Indians | 0.0 /100 | #319 | Tragic 2.9% |
| Chickasaw | 0.0 /100 | #320 | Tragic 2.9% |
| Navajo | 0.0 /100 | #321 | Tragic 2.9% |
| Comanche | 0.0 /100 | #322 | Tragic 2.9% |
| Seminole | 0.0 /100 | #323 | Tragic 2.9% |
| Cherokee | 0.0 /100 | #324 | Tragic 2.9% |
| Immigrants from Uzbekistan | 0.0 /100 | #325 | Tragic 2.9% |
Assyrian/Chaldean/Syriac Self-Care Disability Correlation Summary
| Measurement | Assyrian/Chaldean/Syriac Data | Self-Care Disability Data |
| Minimum | 0.017% | 0.43% |
| Maximum | 18.5% | 4.8% |
| Range | 18.5% | 4.4% |
| Mean | 3.4% | 2.6% |
| Median | 2.5% | 2.6% |
| Interquartile 25% (IQ1) | 1.1% | 2.1% |
| Interquartile 75% (IQ3) | 5.0% | 3.3% |
| Interquartile Range (IQR) | 3.8% | 1.2% |
| Standard Deviation (Sample) | 3.2% | 0.95% |
| Standard Deviation (Population) | 3.2% | 0.94% |
Correlation Details
| Assyrian/Chaldean/Syriac Percentile | Sample Size | Self-Care Disability |
[ 0.0% - 0.5% ] 0.017% | 76,583,139 | 2.5% |
[ 0.0% - 0.5% ] 0.088% | 15,759,246 | 2.4% |
[ 0.0% - 0.5% ] 0.14% | 4,979,887 | 2.2% |
[ 0.0% - 0.5% ] 0.19% | 2,662,838 | 2.4% |
[ 0.0% - 0.5% ] 0.25% | 1,580,204 | 2.2% |
[ 0.0% - 0.5% ] 0.31% | 2,274,746 | 2.4% |
[ 0.0% - 0.5% ] 0.38% | 427,498 | 2.3% |
[ 0.0% - 0.5% ] 0.43% | 731,056 | 2.0% |
[ 0.0% - 0.5% ] 0.49% | 414,769 | 2.2% |
[ 0.5% - 1.0% ] 0.54% | 371,348 | 2.2% |
[ 0.5% - 1.0% ] 0.61% | 223,333 | 3.0% |
[ 0.5% - 1.0% ] 0.65% | 153,305 | 2.6% |
[ 0.5% - 1.0% ] 0.71% | 161,276 | 3.5% |
[ 0.5% - 1.0% ] 0.76% | 100,899 | 2.2% |
[ 0.5% - 1.0% ] 0.83% | 254,310 | 2.3% |
[ 0.5% - 1.0% ] 0.89% | 448,550 | 2.6% |
[ 0.5% - 1.0% ] 0.94% | 357,524 | 2.1% |
[ 1.0% - 1.5% ] 1.01% | 121,482 | 1.4% |
[ 1.0% - 1.5% ] 1.09% | 67,503 | 3.0% |
[ 1.0% - 1.5% ] 1.14% | 55,734 | 3.0% |
[ 1.0% - 1.5% ] 1.20% | 25,085 | 2.4% |
[ 1.0% - 1.5% ] 1.24% | 117,360 | 3.0% |
[ 1.0% - 1.5% ] 1.31% | 65,393 | 1.6% |
[ 1.0% - 1.5% ] 1.35% | 148,615 | 2.1% |
[ 1.0% - 1.5% ] 1.43% | 43,921 | 1.8% |
[ 1.0% - 1.5% ] 1.45% | 79,187 | 1.8% |
[ 1.5% - 2.0% ] 1.52% | 106,355 | 2.6% |
[ 1.5% - 2.0% ] 1.61% | 747 | 0.83% |
[ 1.5% - 2.0% ] 1.64% | 53,590 | 2.6% |
[ 1.5% - 2.0% ] 1.68% | 105,302 | 3.5% |
[ 1.5% - 2.0% ] 1.75% | 28,253 | 2.2% |
[ 1.5% - 2.0% ] 1.87% | 197,840 | 3.1% |
[ 1.5% - 2.0% ] 1.94% | 37,785 | 2.7% |
[ 2.0% - 2.5% ] 2.07% | 5,704 | 0.88% |
[ 2.0% - 2.5% ] 2.10% | 27,827 | 1.8% |
[ 2.0% - 2.5% ] 2.18% | 83,562 | 2.7% |
[ 2.0% - 2.5% ] 2.21% | 9,329 | 3.8% |
[ 2.0% - 2.5% ] 2.28% | 33,033 | 2.9% |
[ 2.0% - 2.5% ] 2.46% | 57,042 | 3.6% |
[ 2.0% - 2.5% ] 2.49% | 1,729 | 1.2% |
[ 2.5% - 3.0% ] 2.55% | 61,494 | 2.8% |
[ 2.5% - 3.0% ] 2.64% | 4,400 | 0.67% |
[ 2.5% - 3.0% ] 2.68% | 78,068 | 4.4% |
[ 2.5% - 3.0% ] 2.76% | 38,003 | 2.1% |
[ 2.5% - 3.0% ] 2.85% | 3,864 | 3.3% |
[ 2.5% - 3.0% ] 3.00% | 1,567 | 1.2% |
[ 3.0% - 3.5% ] 3.16% | 19,083 | 3.5% |
[ 3.0% - 3.5% ] 3.17% | 14,403 | 3.9% |
[ 3.0% - 3.5% ] 3.32% | 59,225 | 1.9% |
[ 3.0% - 3.5% ] 3.35% | 179 | 1.1% |
[ 3.0% - 3.5% ] 3.43% | 19,135 | 1.7% |
[ 3.5% - 4.0% ] 3.55% | 23,765 | 1.5% |
[ 3.5% - 4.0% ] 3.79% | 2,771 | 0.96% |
[ 3.5% - 4.0% ] 3.87% | 45,266 | 2.6% |
[ 4.0% - 4.5% ] 4.02% | 448 | 0.93% |
[ 4.0% - 4.5% ] 4.29% | 128,151 | 4.0% |
[ 4.0% - 4.5% ] 4.33% | 3,698 | 4.8% |
[ 4.0% - 4.5% ] 4.40% | 96,358 | 2.8% |
[ 4.5% - 5.0% ] 4.69% | 59,775 | 4.4% |
[ 4.5% - 5.0% ] 4.96% | 26,536 | 4.1% |
[ 5.0% - 5.5% ] 5.16% | 4,402 | 2.8% |
[ 5.0% - 5.5% ] 5.23% | 45,937 | 3.7% |
[ 5.0% - 5.5% ] 5.25% | 27,848 | 2.8% |
[ 5.0% - 5.5% ] 5.48% | 67,076 | 3.0% |
[ 5.5% - 6.0% ] 5.56% | 34,004 | 3.3% |
[ 5.5% - 6.0% ] 5.58% | 9,320 | 2.4% |
[ 5.5% - 6.0% ] 5.66% | 29,330 | 3.5% |
[ 5.5% - 6.0% ] 5.91% | 22,152 | 1.4% |
[ 5.5% - 6.0% ] 5.94% | 33,170 | 2.7% |
[ 6.0% - 6.5% ] 6.32% | 2,342 | 2.4% |
[ 6.5% - 7.0% ] 6.60% | 16,742 | 3.7% |
[ 7.0% - 7.5% ] 7.02% | 38,727 | 2.4% |
[ 8.5% - 9.0% ] 8.86% | 4,525 | 0.43% |
[ 9.0% - 9.5% ] 9.27% | 34,921 | 3.4% |
[ 9.5% - 10.0% ] 9.58% | 33,174 | 2.6% |
[ 10.5% - 11.0% ] 10.51% | 21,587 | 3.8% |
[ 11.0% - 11.5% ] 11.00% | 6,018 | 2.4% |
[ 11.0% - 11.5% ] 11.50% | 133,744 | 3.7% |
[ 18.0% - 18.5% ] 18.47% | 43,232 | 4.2% |