Vietnamese Self-Care Disability
COMPARE
Vietnamese
Select to Compare
Self-Care Disability
Vietnamese Self-Care Disability
2.6%
SELF-CARE DISABILITY
2.1/ 100
METRIC RATING
234th/ 347
METRIC RANK
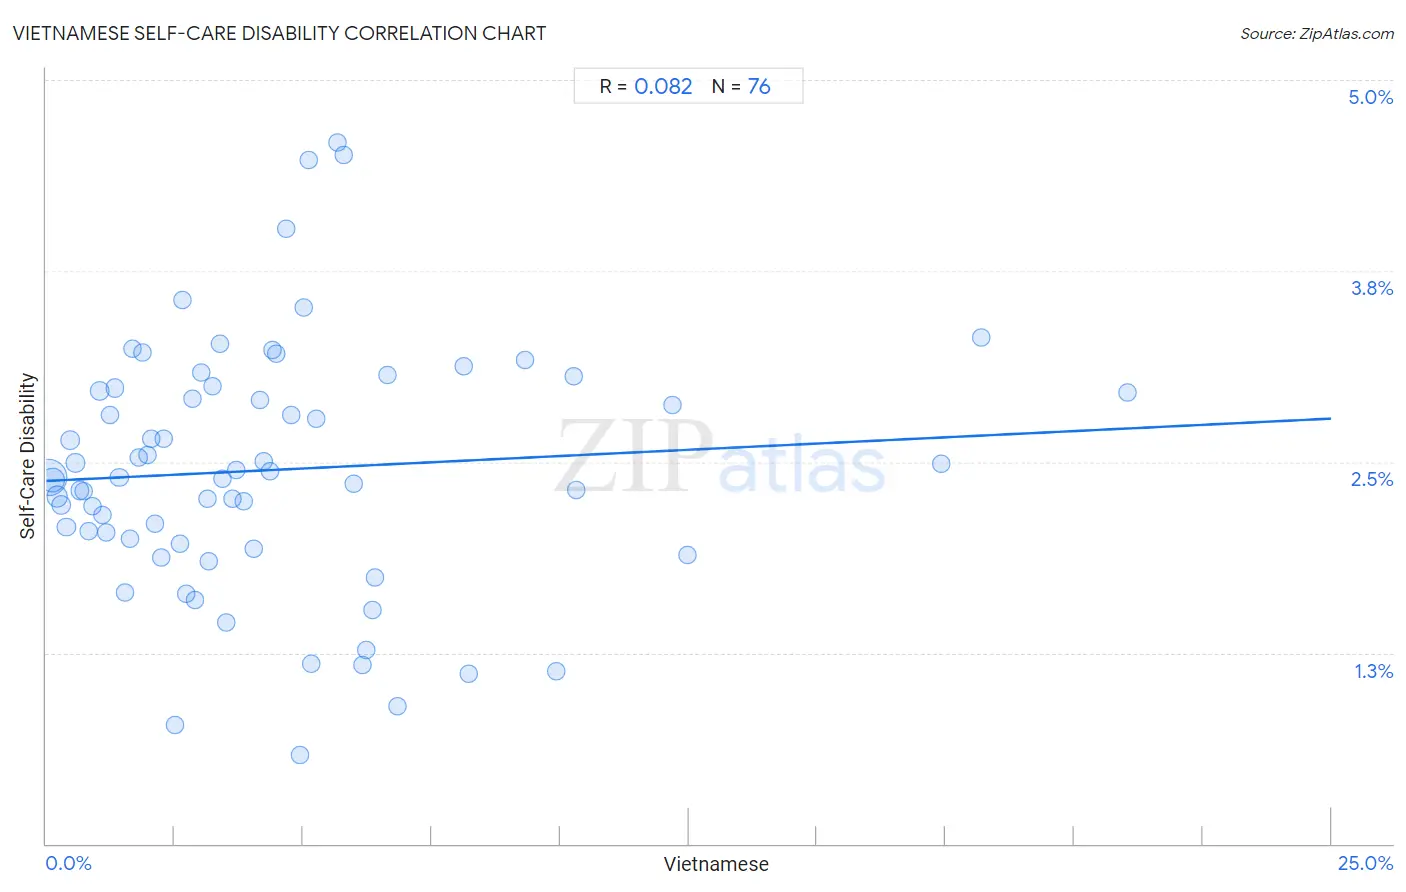
Vietnamese Self-Care Disability Correlation Chart
The statistical analysis conducted on geographies consisting of 170,626,473 people shows a slight positive correlation between the proportion of Vietnamese and percentage of population with self-care disability in the United States with a correlation coefficient (R) of 0.082 and weighted average of 2.6%. On average, for every 1% (one percent) increase in Vietnamese within a typical geography, there is an increase of 0.016% in percentage of population with self-care disability.
It is essential to understand that the correlation between the percentage of Vietnamese and percentage of population with self-care disability does not imply a direct cause-and-effect relationship. It remains uncertain whether the presence of Vietnamese influences an upward or downward trend in the level of percentage of population with self-care disability within an area, or if Vietnamese simply ended up residing in those areas with higher or lower levels of percentage of population with self-care disability due to other factors.
Demographics Similar to Vietnamese by Self-Care Disability
In terms of self-care disability, the demographic groups most similar to Vietnamese are Liberian (2.6%, a difference of 0.010%), Bahamian (2.6%, a difference of 0.040%), Albanian (2.6%, a difference of 0.050%), Immigrants from Guatemala (2.6%, a difference of 0.070%), and Bermudan (2.6%, a difference of 0.10%).
| Demographics | Rating | Rank | Self-Care Disability |
| Immigrants from Philippines | 2.7 /100 | #227 | Tragic 2.6% |
| Guatemalans | 2.7 /100 | #228 | Tragic 2.6% |
| Guamanians/Chamorros | 2.5 /100 | #229 | Tragic 2.6% |
| Immigrants from Ecuador | 2.5 /100 | #230 | Tragic 2.6% |
| Immigrants from Guatemala | 2.2 /100 | #231 | Tragic 2.6% |
| Albanians | 2.2 /100 | #232 | Tragic 2.6% |
| Liberians | 2.1 /100 | #233 | Tragic 2.6% |
| Vietnamese | 2.1 /100 | #234 | Tragic 2.6% |
| Bahamians | 2.0 /100 | #235 | Tragic 2.6% |
| Bermudans | 1.9 /100 | #236 | Tragic 2.6% |
| Immigrants from Senegal | 1.6 /100 | #237 | Tragic 2.6% |
| Senegalese | 1.3 /100 | #238 | Tragic 2.6% |
| Immigrants from Panama | 1.2 /100 | #239 | Tragic 2.6% |
| Marshallese | 1.2 /100 | #240 | Tragic 2.6% |
| Immigrants from Syria | 1.0 /100 | #241 | Tragic 2.6% |
Vietnamese Self-Care Disability Correlation Summary
| Measurement | Vietnamese Data | Self-Care Disability Data |
| Minimum | 0.038% | 0.58% |
| Maximum | 21.0% | 4.6% |
| Range | 21.0% | 4.0% |
| Mean | 4.4% | 2.4% |
| Median | 3.4% | 2.4% |
| Interquartile 25% (IQ1) | 1.7% | 2.0% |
| Interquartile 75% (IQ3) | 5.7% | 3.0% |
| Interquartile Range (IQR) | 4.1% | 0.99% |
| Standard Deviation (Sample) | 4.1% | 0.82% |
| Standard Deviation (Population) | 4.1% | 0.81% |
Correlation Details
| Vietnamese Percentile | Sample Size | Self-Care Disability |
[ 0.0% - 0.5% ] 0.038% | 90,678,414 | 2.4% |
[ 0.0% - 0.5% ] 0.12% | 29,652,467 | 2.4% |
[ 0.0% - 0.5% ] 0.21% | 15,121,899 | 2.3% |
[ 0.0% - 0.5% ] 0.30% | 6,455,233 | 2.2% |
[ 0.0% - 0.5% ] 0.39% | 4,472,692 | 2.1% |
[ 0.0% - 0.5% ] 0.47% | 4,252,803 | 2.6% |
[ 0.5% - 1.0% ] 0.57% | 2,003,493 | 2.5% |
[ 0.5% - 1.0% ] 0.64% | 1,394,658 | 2.3% |
[ 0.5% - 1.0% ] 0.73% | 769,480 | 2.3% |
[ 0.5% - 1.0% ] 0.83% | 1,000,551 | 2.0% |
[ 0.5% - 1.0% ] 0.91% | 639,351 | 2.2% |
[ 1.0% - 1.5% ] 1.04% | 9,319,680 | 3.0% |
[ 1.0% - 1.5% ] 1.09% | 309,952 | 2.1% |
[ 1.0% - 1.5% ] 1.16% | 315,981 | 2.0% |
[ 1.0% - 1.5% ] 1.24% | 264,442 | 2.8% |
[ 1.0% - 1.5% ] 1.34% | 778,051 | 3.0% |
[ 1.0% - 1.5% ] 1.42% | 287,008 | 2.4% |
[ 1.5% - 2.0% ] 1.54% | 43,867 | 1.6% |
[ 1.5% - 2.0% ] 1.62% | 201,906 | 2.0% |
[ 1.5% - 2.0% ] 1.69% | 199,200 | 3.2% |
[ 1.5% - 2.0% ] 1.81% | 123,795 | 2.5% |
[ 1.5% - 2.0% ] 1.88% | 146,617 | 3.2% |
[ 1.5% - 2.0% ] 1.96% | 22,008 | 2.5% |
[ 2.0% - 2.5% ] 2.04% | 91,751 | 2.7% |
[ 2.0% - 2.5% ] 2.13% | 143,236 | 2.1% |
[ 2.0% - 2.5% ] 2.23% | 53,029 | 1.9% |
[ 2.0% - 2.5% ] 2.29% | 195,433 | 2.7% |
[ 2.5% - 3.0% ] 2.50% | 11,309 | 0.78% |
[ 2.5% - 3.0% ] 2.60% | 883 | 2.0% |
[ 2.5% - 3.0% ] 2.64% | 138,588 | 3.6% |
[ 2.5% - 3.0% ] 2.72% | 14,685 | 1.6% |
[ 2.5% - 3.0% ] 2.85% | 83,275 | 2.9% |
[ 2.5% - 3.0% ] 2.89% | 25,324 | 1.6% |
[ 3.0% - 3.5% ] 3.02% | 5,095 | 3.1% |
[ 3.0% - 3.5% ] 3.13% | 45,881 | 2.3% |
[ 3.0% - 3.5% ] 3.17% | 54,323 | 1.8% |
[ 3.0% - 3.5% ] 3.24% | 15,503 | 3.0% |
[ 3.0% - 3.5% ] 3.38% | 8,879 | 3.3% |
[ 3.0% - 3.5% ] 3.43% | 186,165 | 2.4% |
[ 3.0% - 3.5% ] 3.50% | 2,230 | 1.4% |
[ 3.5% - 4.0% ] 3.61% | 7,775 | 2.3% |
[ 3.5% - 4.0% ] 3.69% | 7,692 | 2.4% |
[ 3.5% - 4.0% ] 3.84% | 44,898 | 2.2% |
[ 4.0% - 4.5% ] 4.04% | 19,750 | 1.9% |
[ 4.0% - 4.5% ] 4.16% | 28,164 | 2.9% |
[ 4.0% - 4.5% ] 4.24% | 69,256 | 2.5% |
[ 4.0% - 4.5% ] 4.34% | 67,001 | 2.4% |
[ 4.0% - 4.5% ] 4.40% | 19,554 | 3.2% |
[ 4.0% - 4.5% ] 4.47% | 5,120 | 3.2% |
[ 4.5% - 5.0% ] 4.67% | 68,656 | 4.0% |
[ 4.5% - 5.0% ] 4.75% | 27,848 | 2.8% |
[ 4.5% - 5.0% ] 4.93% | 548 | 0.58% |
[ 5.0% - 5.5% ] 5.01% | 46,520 | 3.5% |
[ 5.0% - 5.5% ] 5.10% | 77,230 | 4.5% |
[ 5.0% - 5.5% ] 5.15% | 6,510 | 1.2% |
[ 5.0% - 5.5% ] 5.25% | 6,965 | 2.8% |
[ 5.5% - 6.0% ] 5.67% | 43,216 | 4.6% |
[ 5.5% - 6.0% ] 5.78% | 25,187 | 4.5% |
[ 5.5% - 6.0% ] 5.99% | 3,958 | 2.4% |
[ 6.0% - 6.5% ] 6.16% | 86,977 | 1.2% |
[ 6.0% - 6.5% ] 6.23% | 1,460 | 1.3% |
[ 6.0% - 6.5% ] 6.34% | 102,618 | 1.5% |
[ 6.0% - 6.5% ] 6.39% | 10,691 | 1.7% |
[ 6.5% - 7.0% ] 6.64% | 29,441 | 3.1% |
[ 6.5% - 7.0% ] 6.83% | 26,939 | 0.90% |
[ 8.0% - 8.5% ] 8.12% | 4,064 | 3.1% |
[ 8.0% - 8.5% ] 8.21% | 1,900 | 1.1% |
[ 9.0% - 9.5% ] 9.30% | 344 | 3.2% |
[ 9.5% - 10.0% ] 9.92% | 2,571 | 1.1% |
[ 10.0% - 10.5% ] 10.27% | 38,865 | 3.1% |
[ 10.0% - 10.5% ] 10.32% | 59,961 | 2.3% |
[ 12.0% - 12.5% ] 12.18% | 3,006 | 2.9% |
[ 12.0% - 12.5% ] 12.48% | 17,328 | 1.9% |
[ 17.0% - 17.5% ] 17.42% | 27,842 | 2.5% |
[ 18.0% - 18.5% ] 18.18% | 43,213 | 3.3% |
[ 21.0% - 21.5% ] 21.03% | 64,268 | 3.0% |