Immigrants from Burma/Myanmar Self-Care Disability
COMPARE
Immigrants from Burma/Myanmar
Select to Compare
Self-Care Disability
Immigrants from Burma/Myanmar Self-Care Disability
2.5%
SELF-CARE DISABILITY
52.8/ 100
METRIC RATING
173rd/ 347
METRIC RANK
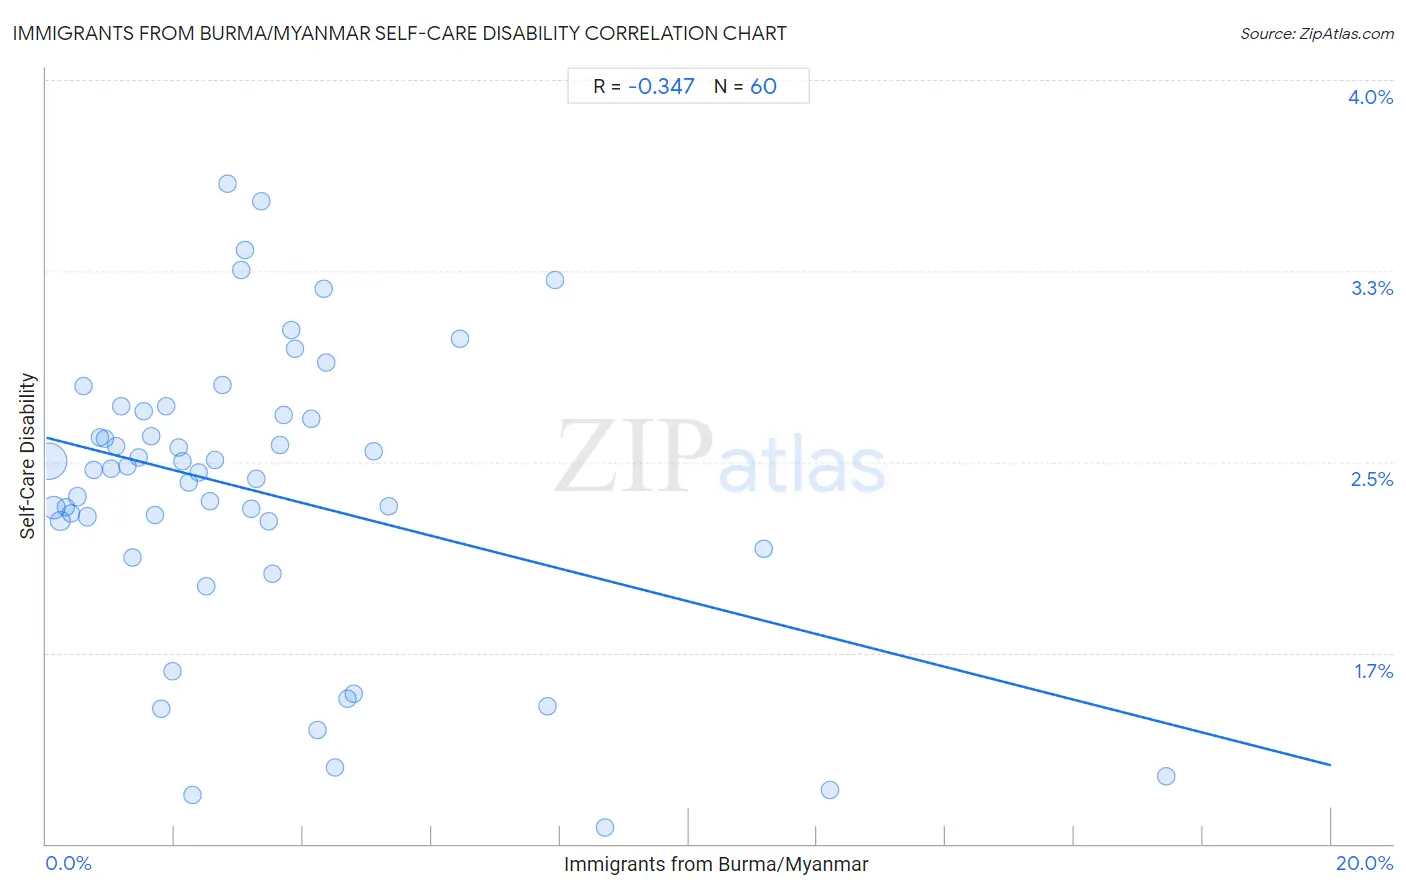
Immigrants from Burma/Myanmar Self-Care Disability Correlation Chart
The statistical analysis conducted on geographies consisting of 172,240,034 people shows a mild negative correlation between the proportion of Immigrants from Burma/Myanmar and percentage of population with self-care disability in the United States with a correlation coefficient (R) of -0.347 and weighted average of 2.5%. On average, for every 1% (one percent) increase in Immigrants from Burma/Myanmar within a typical geography, there is a decrease of 0.064% in percentage of population with self-care disability.
It is essential to understand that the correlation between the percentage of Immigrants from Burma/Myanmar and percentage of population with self-care disability does not imply a direct cause-and-effect relationship. It remains uncertain whether the presence of Immigrants from Burma/Myanmar influences an upward or downward trend in the level of percentage of population with self-care disability within an area, or if Immigrants from Burma/Myanmar simply ended up residing in those areas with higher or lower levels of percentage of population with self-care disability due to other factors.
Demographics Similar to Immigrants from Burma/Myanmar by Self-Care Disability
In terms of self-care disability, the demographic groups most similar to Immigrants from Burma/Myanmar are Pennsylvania German (2.5%, a difference of 0.030%), Czechoslovakian (2.5%, a difference of 0.030%), Scottish (2.5%, a difference of 0.070%), Welsh (2.5%, a difference of 0.13%), and Immigrants from Somalia (2.5%, a difference of 0.15%).
| Demographics | Rating | Rank | Self-Care Disability |
| Canadians | 58.8 /100 | #166 | Average 2.5% |
| Immigrants from Greece | 57.3 /100 | #167 | Average 2.5% |
| Ute | 57.1 /100 | #168 | Average 2.5% |
| Immigrants from Somalia | 55.9 /100 | #169 | Average 2.5% |
| Scottish | 54.3 /100 | #170 | Average 2.5% |
| Pennsylvania Germans | 53.5 /100 | #171 | Average 2.5% |
| Czechoslovakians | 53.5 /100 | #172 | Average 2.5% |
| Immigrants from Burma/Myanmar | 52.8 /100 | #173 | Average 2.5% |
| Welsh | 50.0 /100 | #174 | Average 2.5% |
| Immigrants from Bosnia and Herzegovina | 49.6 /100 | #175 | Average 2.5% |
| Immigrants from Afghanistan | 47.6 /100 | #176 | Average 2.5% |
| Immigrants from Kazakhstan | 46.7 /100 | #177 | Average 2.5% |
| English | 46.2 /100 | #178 | Average 2.5% |
| Hungarians | 45.5 /100 | #179 | Average 2.5% |
| Indonesians | 41.2 /100 | #180 | Average 2.5% |
Immigrants from Burma/Myanmar Self-Care Disability Correlation Summary
| Measurement | Immigrants from Burma/Myanmar Data | Self-Care Disability Data |
| Minimum | 0.038% | 1.1% |
| Maximum | 17.4% | 3.6% |
| Range | 17.4% | 2.5% |
| Mean | 3.3% | 2.4% |
| Median | 2.6% | 2.5% |
| Interquartile 25% (IQ1) | 1.3% | 2.2% |
| Interquartile 75% (IQ3) | 4.2% | 2.7% |
| Interquartile Range (IQR) | 2.9% | 0.48% |
| Standard Deviation (Sample) | 3.1% | 0.58% |
| Standard Deviation (Population) | 3.1% | 0.57% |
Correlation Details
| Immigrants from Burma/Myanmar Percentile | Sample Size | Self-Care Disability |
[ 0.0% - 0.5% ] 0.038% | 109,818,160 | 2.5% |
[ 0.0% - 0.5% ] 0.12% | 28,019,752 | 2.3% |
[ 0.0% - 0.5% ] 0.22% | 10,619,049 | 2.3% |
[ 0.0% - 0.5% ] 0.30% | 4,412,877 | 2.3% |
[ 0.0% - 0.5% ] 0.38% | 3,395,444 | 2.3% |
[ 0.0% - 0.5% ] 0.48% | 2,408,936 | 2.4% |
[ 0.5% - 1.0% ] 0.58% | 2,457,194 | 2.8% |
[ 0.5% - 1.0% ] 0.65% | 1,513,851 | 2.3% |
[ 0.5% - 1.0% ] 0.73% | 1,356,368 | 2.5% |
[ 0.5% - 1.0% ] 0.84% | 1,123,551 | 2.6% |
[ 0.5% - 1.0% ] 0.92% | 636,007 | 2.6% |
[ 1.0% - 1.5% ] 1.00% | 592,676 | 2.5% |
[ 1.0% - 1.5% ] 1.08% | 1,357,765 | 2.6% |
[ 1.0% - 1.5% ] 1.17% | 419,756 | 2.7% |
[ 1.0% - 1.5% ] 1.26% | 438,016 | 2.5% |
[ 1.0% - 1.5% ] 1.34% | 223,860 | 2.1% |
[ 1.0% - 1.5% ] 1.43% | 406,089 | 2.5% |
[ 1.5% - 2.0% ] 1.51% | 310,391 | 2.7% |
[ 1.5% - 2.0% ] 1.63% | 392,187 | 2.6% |
[ 1.5% - 2.0% ] 1.69% | 182,155 | 2.3% |
[ 1.5% - 2.0% ] 1.79% | 185,148 | 1.5% |
[ 1.5% - 2.0% ] 1.86% | 432,147 | 2.7% |
[ 1.5% - 2.0% ] 1.97% | 19,626 | 1.7% |
[ 2.0% - 2.5% ] 2.06% | 256,522 | 2.6% |
[ 2.0% - 2.5% ] 2.13% | 35,419 | 2.5% |
[ 2.0% - 2.5% ] 2.22% | 55,094 | 2.4% |
[ 2.0% - 2.5% ] 2.29% | 12,778 | 1.2% |
[ 2.0% - 2.5% ] 2.37% | 51,767 | 2.5% |
[ 2.0% - 2.5% ] 2.48% | 133,569 | 2.0% |
[ 2.5% - 3.0% ] 2.55% | 126,252 | 2.3% |
[ 2.5% - 3.0% ] 2.63% | 48,939 | 2.5% |
[ 2.5% - 3.0% ] 2.74% | 85,513 | 2.8% |
[ 2.5% - 3.0% ] 2.81% | 34,537 | 3.6% |
[ 3.0% - 3.5% ] 3.03% | 24,684 | 3.3% |
[ 3.0% - 3.5% ] 3.10% | 94,089 | 3.3% |
[ 3.0% - 3.5% ] 3.19% | 24,971 | 2.3% |
[ 3.0% - 3.5% ] 3.27% | 33,912 | 2.4% |
[ 3.0% - 3.5% ] 3.34% | 15,556 | 3.5% |
[ 3.0% - 3.5% ] 3.47% | 58,574 | 2.3% |
[ 3.5% - 4.0% ] 3.53% | 12,010 | 2.1% |
[ 3.5% - 4.0% ] 3.65% | 3,126 | 2.6% |
[ 3.5% - 4.0% ] 3.70% | 23,980 | 2.7% |
[ 3.5% - 4.0% ] 3.81% | 57,662 | 3.0% |
[ 3.5% - 4.0% ] 3.88% | 15,899 | 2.9% |
[ 4.0% - 4.5% ] 4.12% | 25,699 | 2.7% |
[ 4.0% - 4.5% ] 4.21% | 23,879 | 1.4% |
[ 4.0% - 4.5% ] 4.31% | 81,015 | 3.2% |
[ 4.0% - 4.5% ] 4.36% | 2,039 | 2.9% |
[ 4.0% - 4.5% ] 4.48% | 2,029 | 1.3% |
[ 4.5% - 5.0% ] 4.69% | 14,553 | 1.6% |
[ 4.5% - 5.0% ] 4.78% | 2,219 | 1.6% |
[ 5.0% - 5.5% ] 5.11% | 5,268 | 2.5% |
[ 5.0% - 5.5% ] 5.33% | 37,834 | 2.3% |
[ 6.0% - 6.5% ] 6.45% | 19,501 | 3.0% |
[ 7.5% - 8.0% ] 7.81% | 39,082 | 1.5% |
[ 7.5% - 8.0% ] 7.92% | 56,794 | 3.2% |
[ 8.5% - 9.0% ] 8.70% | 1,035 | 1.1% |
[ 11.0% - 11.5% ] 11.17% | 403 | 2.2% |
[ 12.0% - 12.5% ] 12.20% | 738 | 1.2% |
[ 17.0% - 17.5% ] 17.43% | 2,088 | 1.3% |