Sioux Self-Care Disability
COMPARE
Sioux
Select to Compare
Self-Care Disability
Sioux Self-Care Disability
2.5%
SELF-CARE DISABILITY
24.6/ 100
METRIC RATING
190th/ 347
METRIC RANK
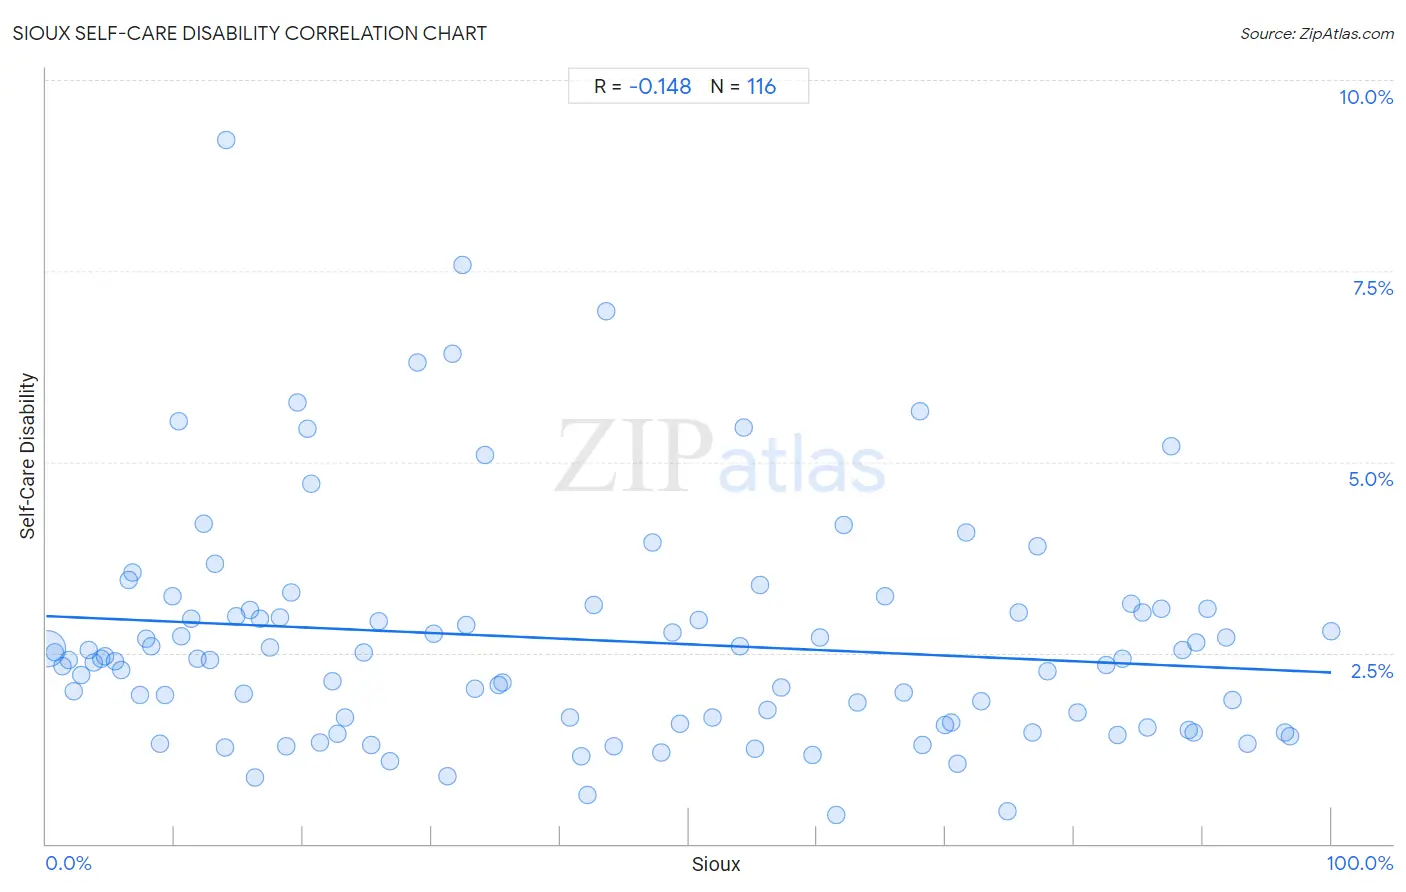
Sioux Self-Care Disability Correlation Chart
The statistical analysis conducted on geographies consisting of 233,917,854 people shows a poor negative correlation between the proportion of Sioux and percentage of population with self-care disability in the United States with a correlation coefficient (R) of -0.148 and weighted average of 2.5%. On average, for every 1% (one percent) increase in Sioux within a typical geography, there is a decrease of 0.0074% in percentage of population with self-care disability.
It is essential to understand that the correlation between the percentage of Sioux and percentage of population with self-care disability does not imply a direct cause-and-effect relationship. It remains uncertain whether the presence of Sioux influences an upward or downward trend in the level of percentage of population with self-care disability within an area, or if Sioux simply ended up residing in those areas with higher or lower levels of percentage of population with self-care disability due to other factors.
Demographics Similar to Sioux by Self-Care Disability
In terms of self-care disability, the demographic groups most similar to Sioux are Moroccan (2.5%, a difference of 0.11%), Soviet Union (2.5%, a difference of 0.16%), Immigrants from Eastern Europe (2.5%, a difference of 0.21%), Immigrants from Oceania (2.5%, a difference of 0.22%), and Ukrainian (2.5%, a difference of 0.22%).
| Demographics | Rating | Rank | Self-Care Disability |
| Salvadorans | 36.4 /100 | #183 | Fair 2.5% |
| Yugoslavians | 36.1 /100 | #184 | Fair 2.5% |
| Slavs | 34.3 /100 | #185 | Fair 2.5% |
| Immigrants from El Salvador | 33.0 /100 | #186 | Fair 2.5% |
| Irish | 28.7 /100 | #187 | Fair 2.5% |
| Immigrants from Oceania | 28.3 /100 | #188 | Fair 2.5% |
| Immigrants from Eastern Europe | 28.0 /100 | #189 | Fair 2.5% |
| Sioux | 24.6 /100 | #190 | Fair 2.5% |
| Moroccans | 22.9 /100 | #191 | Fair 2.5% |
| Soviet Union | 22.2 /100 | #192 | Fair 2.5% |
| Ukrainians | 21.4 /100 | #193 | Fair 2.5% |
| Immigrants from Germany | 17.9 /100 | #194 | Poor 2.5% |
| Immigrants from Southern Europe | 15.6 /100 | #195 | Poor 2.5% |
| Koreans | 15.5 /100 | #196 | Poor 2.5% |
| Crow | 15.2 /100 | #197 | Poor 2.5% |
Sioux Self-Care Disability Correlation Summary
| Measurement | Sioux Data | Self-Care Disability Data |
| Minimum | 0.069% | 0.38% |
| Maximum | 100.0% | 9.2% |
| Range | 99.9% | 8.8% |
| Mean | 42.3% | 2.7% |
| Median | 35.4% | 2.4% |
| Interquartile 25% (IQ1) | 14.4% | 1.6% |
| Interquartile 75% (IQ3) | 70.2% | 3.1% |
| Interquartile Range (IQR) | 55.8% | 1.5% |
| Standard Deviation (Sample) | 30.4% | 1.5% |
| Standard Deviation (Population) | 30.3% | 1.5% |
Correlation Details
| Sioux Percentile | Sample Size | Self-Care Disability |
[ 0.0% - 0.5% ] 0.069% | 226,244,482 | 2.6% |
[ 0.5% - 1.0% ] 0.68% | 4,502,498 | 2.5% |
[ 1.0% - 1.5% ] 1.23% | 1,014,585 | 2.3% |
[ 1.5% - 2.0% ] 1.71% | 470,079 | 2.4% |
[ 2.0% - 2.5% ] 2.18% | 600,946 | 2.0% |
[ 2.5% - 3.0% ] 2.73% | 176,406 | 2.2% |
[ 3.0% - 3.5% ] 3.27% | 162,235 | 2.5% |
[ 3.5% - 4.0% ] 3.71% | 78,348 | 2.4% |
[ 4.0% - 4.5% ] 4.29% | 96,519 | 2.4% |
[ 4.5% - 5.0% ] 4.59% | 46,424 | 2.5% |
[ 5.0% - 5.5% ] 5.31% | 23,307 | 2.4% |
[ 5.5% - 6.0% ] 5.81% | 21,065 | 2.3% |
[ 6.0% - 6.5% ] 6.39% | 41,326 | 3.5% |
[ 6.5% - 7.0% ] 6.73% | 29,390 | 3.6% |
[ 7.0% - 7.5% ] 7.30% | 5,740 | 2.0% |
[ 7.5% - 8.0% ] 7.79% | 4,198 | 2.7% |
[ 8.0% - 8.5% ] 8.19% | 3,566 | 2.6% |
[ 8.5% - 9.0% ] 8.88% | 20,178 | 1.3% |
[ 9.0% - 9.5% ] 9.20% | 12,691 | 1.9% |
[ 9.5% - 10.0% ] 9.84% | 40,984 | 3.2% |
[ 10.0% - 10.5% ] 10.26% | 3,420 | 5.5% |
[ 10.5% - 11.0% ] 10.52% | 75,762 | 2.7% |
[ 11.0% - 11.5% ] 11.30% | 27,472 | 3.0% |
[ 11.5% - 12.0% ] 11.74% | 2,939 | 2.4% |
[ 12.0% - 12.5% ] 12.23% | 7,277 | 4.2% |
[ 12.5% - 13.0% ] 12.75% | 11,918 | 2.4% |
[ 13.0% - 13.5% ] 13.11% | 1,121 | 3.7% |
[ 13.5% - 14.0% ] 13.89% | 3,601 | 1.3% |
[ 14.0% - 14.5% ] 14.02% | 107 | 9.2% |
[ 14.5% - 15.0% ] 14.79% | 46,791 | 3.0% |
[ 15.0% - 15.5% ] 15.38% | 5,721 | 2.0% |
[ 15.5% - 16.0% ] 15.81% | 7,679 | 3.1% |
[ 16.0% - 16.5% ] 16.23% | 493 | 0.86% |
[ 16.5% - 17.0% ] 16.61% | 313 | 3.0% |
[ 17.0% - 17.5% ] 17.42% | 6,057 | 2.6% |
[ 18.0% - 18.5% ] 18.14% | 3,318 | 3.0% |
[ 18.5% - 19.0% ] 18.65% | 252 | 1.3% |
[ 19.0% - 19.5% ] 19.09% | 508 | 3.3% |
[ 19.5% - 20.0% ] 19.60% | 3,888 | 5.8% |
[ 20.0% - 20.5% ] 20.30% | 739 | 5.4% |
[ 20.5% - 21.0% ] 20.64% | 5,529 | 4.7% |
[ 21.0% - 21.5% ] 21.27% | 1,763 | 1.3% |
[ 22.0% - 22.5% ] 22.25% | 3,735 | 2.1% |
[ 22.5% - 23.0% ] 22.66% | 1,284 | 1.4% |
[ 23.0% - 23.5% ] 23.22% | 715 | 1.7% |
[ 24.5% - 25.0% ] 24.74% | 5,133 | 2.5% |
[ 25.0% - 25.5% ] 25.31% | 976 | 1.3% |
[ 25.5% - 26.0% ] 25.87% | 688 | 2.9% |
[ 26.5% - 27.0% ] 26.74% | 2,315 | 1.1% |
[ 28.5% - 29.0% ] 28.94% | 1,479 | 6.3% |
[ 30.0% - 30.5% ] 30.15% | 534 | 2.7% |
[ 31.0% - 31.5% ] 31.20% | 484 | 0.89% |
[ 31.5% - 32.0% ] 31.58% | 95 | 6.4% |
[ 32.0% - 32.5% ] 32.35% | 68 | 7.6% |
[ 32.5% - 33.0% ] 32.73% | 440 | 2.9% |
[ 33.0% - 33.5% ] 33.33% | 99 | 2.0% |
[ 34.0% - 34.5% ] 34.18% | 1,021 | 5.1% |
[ 35.0% - 35.5% ] 35.20% | 125 | 2.1% |
[ 35.5% - 36.0% ] 35.54% | 1,210 | 2.1% |
[ 40.5% - 41.0% ] 40.74% | 842 | 1.6% |
[ 41.5% - 42.0% ] 41.63% | 627 | 1.1% |
[ 42.0% - 42.5% ] 42.16% | 1,155 | 0.65% |
[ 42.5% - 43.0% ] 42.58% | 209 | 3.1% |
[ 43.5% - 44.0% ] 43.61% | 876 | 7.0% |
[ 44.0% - 44.5% ] 44.17% | 1,621 | 1.3% |
[ 47.0% - 47.5% ] 47.15% | 2,195 | 3.9% |
[ 47.5% - 48.0% ] 47.83% | 3,410 | 1.2% |
[ 48.5% - 49.0% ] 48.75% | 681 | 2.8% |
[ 49.0% - 49.5% ] 49.30% | 3,509 | 1.6% |
[ 50.5% - 51.0% ] 50.74% | 1,346 | 2.9% |
[ 51.5% - 52.0% ] 51.86% | 295 | 1.7% |
[ 53.5% - 54.0% ] 53.99% | 1,504 | 2.6% |
[ 54.0% - 54.5% ] 54.24% | 59 | 5.5% |
[ 55.0% - 55.5% ] 55.13% | 5,389 | 1.2% |
[ 55.5% - 56.0% ] 55.50% | 218 | 3.4% |
[ 56.0% - 56.5% ] 56.14% | 6,429 | 1.8% |
[ 57.0% - 57.5% ] 57.21% | 3,905 | 2.0% |
[ 59.5% - 60.0% ] 59.58% | 574 | 1.2% |
[ 60.0% - 60.5% ] 60.20% | 912 | 2.7% |
[ 61.0% - 61.5% ] 61.48% | 283 | 0.38% |
[ 62.0% - 62.5% ] 62.10% | 926 | 4.2% |
[ 63.0% - 63.5% ] 63.12% | 526 | 1.9% |
[ 65.0% - 65.5% ] 65.24% | 1,168 | 3.2% |
[ 66.5% - 67.0% ] 66.75% | 2,505 | 2.0% |
[ 67.5% - 68.0% ] 67.99% | 2,009 | 5.7% |
[ 68.0% - 68.5% ] 68.23% | 3,516 | 1.3% |
[ 69.5% - 70.0% ] 69.90% | 1,256 | 1.6% |
[ 70.0% - 70.5% ] 70.42% | 896 | 1.6% |
[ 70.5% - 71.0% ] 70.93% | 626 | 1.0% |
[ 71.5% - 72.0% ] 71.62% | 229 | 4.1% |
[ 72.5% - 73.0% ] 72.72% | 766 | 1.9% |
[ 74.5% - 75.0% ] 74.78% | 1,812 | 0.42% |
[ 75.5% - 76.0% ] 75.64% | 2,274 | 3.0% |
[ 76.5% - 77.0% ] 76.79% | 280 | 1.5% |
[ 77.0% - 77.5% ] 77.10% | 262 | 3.9% |
[ 77.5% - 78.0% ] 77.87% | 470 | 2.3% |
[ 80.0% - 80.5% ] 80.26% | 233 | 1.7% |
[ 82.0% - 82.5% ] 82.47% | 3,629 | 2.3% |
[ 83.0% - 83.5% ] 83.33% | 144 | 1.4% |
[ 83.5% - 84.0% ] 83.79% | 7,820 | 2.4% |
[ 84.0% - 84.5% ] 84.39% | 410 | 3.1% |
[ 85.0% - 85.5% ] 85.30% | 2,572 | 3.0% |
[ 85.5% - 86.0% ] 85.74% | 2,097 | 1.5% |
[ 86.5% - 87.0% ] 86.74% | 2,843 | 3.1% |
[ 87.0% - 87.5% ] 87.50% | 176 | 5.2% |
[ 88.0% - 88.5% ] 88.38% | 990 | 2.5% |
[ 88.5% - 89.0% ] 88.92% | 343 | 1.5% |
[ 89.0% - 89.5% ] 89.30% | 355 | 1.4% |
[ 89.5% - 90.0% ] 89.54% | 1,157 | 2.6% |
[ 90.0% - 90.5% ] 90.34% | 1,087 | 3.1% |
[ 91.5% - 92.0% ] 91.85% | 1,903 | 2.7% |
[ 92.0% - 92.5% ] 92.30% | 844 | 1.9% |
[ 93.0% - 93.5% ] 93.47% | 1,256 | 1.3% |
[ 96.0% - 96.5% ] 96.40% | 500 | 1.4% |
[ 96.5% - 97.0% ] 96.83% | 1,042 | 1.4% |
[ 99.5% - 100.0% ] 100.00% | 857 | 2.8% |