Immigrants from Switzerland Self-Care Disability

COMPARE

Immigrants from Switzerland
Race
Ancestry
AfghanAfricanAlaska NativeAlaskan AthabascanAlbanianAleutAlsatianAmericanApacheArabArapahoArgentineanArmenianAssyrian/Chaldean/SyriacAustralianAustrianBahamianBangladeshiBarbadianBasqueBelgianBelizeanBermudanBhutaneseBlackfeetBolivianBrazilianBritishBritish West IndianBulgarianBurmeseCajunCambodianCanadianCape VerdeanCarpatho RusynCelticCentral AmericanCentral American IndianCherokeeCheyenneChickasawChileanChineseChippewaChoctawColombianColvilleComancheCosta RicanCreeCreekCroatianCrowCubanCypriotCzechCzechoslovakianDanishDelawareDominicanDutchDutch West IndianEastern EuropeanEcuadorianEgyptianEnglishEstonianEthiopianEuropeanFijianFilipinoFinnishFrenchFrench American IndianFrench CanadianGermanGerman RussianGhanaianGreekGuamanian/ChamorroGuatemalanGuyaneseHaitianHmongHonduranHopiHoumaHungarianIcelanderIndian (Asian)IndonesianInupiatIranianIraqiIrishIroquoisIsraeliItalianJamaicanJapaneseJordanianKenyanKiowaKoreanLaotianLatvianLebaneseLiberianLithuanianLumbeeLuxembourgerMacedonianMalaysianMalteseMarshalleseMenomineeMexicanMexican American IndianMongolianMoroccanNative HawaiianNavajoNepaleseNew ZealanderNicaraguanNigerianNorthern EuropeanNorwegianOkinawanOsageOttawaPaiutePakistaniPalestinianPanamanianParaguayanPennsylvania GermanPeruvianPimaPolishPortuguesePotawatomiPuebloPuerto RicanPuget Sound SalishRomanianRussianSalvadoranSamoanScandinavianScotch-IrishScottishSeminoleSenegaleseSerbianShoshoneSierra LeoneanSiouxSlavicSlovakSloveneSomaliSouth AfricanSouth AmericanSouth American IndianSoviet UnionSpaniardSpanishSpanish AmericanSpanish American IndianSri LankanSubsaharan AfricanSudaneseSwedishSwissSyrianTaiwaneseThaiTlingit-HaidaTohono O'OdhamTonganTrinidadian and TobagonianTsimshianTurkishU.S. Virgin IslanderUgandanUkrainianUruguayanUteVenezuelanVietnameseWelshWest IndianYakamaYaquiYugoslavianYumanYup'ikZimbabwean
Immigration
NonimmigrantsImmigrantsAfghanistanAfricaAlbaniaArgentinaArmeniaAsiaAustraliaAustriaBahamasBangladeshBarbadosBelarusBelgiumBelizeBoliviaBosnia and HerzegovinaBrazilBulgariaBurma/MyanmarCabo VerdeCambodiaCameroonCanadaCaribbeanCentral AmericaChileChinaColombiaCongoCosta RicaCroatiaCubaCzechoslovakiaDenmarkDominicaDominican RepublicEastern AfricaEastern AsiaEastern EuropeEcuadorEgyptEl SalvadorEnglandEritreaEthiopiaEuropeFijiFranceGermanyGhanaGreeceGrenadaGuatemalaGuyanaHaitiHondurasHong KongHungaryIndiaIndonesiaIranIraqIrelandIsraelItalyJamaicaJapanJordanKazakhstanKenyaKoreaKuwaitLaosLatin AmericaLatviaLebanonLiberiaLithuaniaMalaysiaMexicoMicronesiaMiddle AfricaMoldovaMoroccoNepalNetherlandsNicaraguaNigeriaNorth AmericaNorth MacedoniaNorthern AfricaNorthern EuropeNorwayOceaniaPakistanPanamaPeruPhilippinesPolandPortugalRomaniaRussiaSaudi ArabiaScotlandSenegalSerbiaSierra LeoneSingaporeSomaliaSouth AfricaSouth AmericaSouth Central AsiaSouth Eastern AsiaSouthern EuropeSpainSri LankaSt. Vincent and the GrenadinesSudanSwedenSwitzerlandSyriaTaiwanThailandTrinidad and TobagoTurkeyUgandaUkraineUruguayUzbekistanVenezuelaVietnamWest IndiesWestern AfricaWestern AsiaWestern EuropeYemenZaireZimbabweAzores
Select to Compare
Race
Ancestry
AfghanAfricanAlaska NativeAlaskan AthabascanAlbanianAleutAlsatianAmericanApacheArabArapahoArgentineanArmenianAssyrian/Chaldean/SyriacAustralianAustrianBahamianBangladeshiBarbadianBasqueBelgianBelizeanBermudanBhutaneseBlackfeetBolivianBrazilianBritishBritish West IndianBulgarianBurmeseCajunCambodianCanadianCape VerdeanCarpatho RusynCelticCentral AmericanCentral American IndianCherokeeCheyenneChickasawChileanChineseChippewaChoctawColombianColvilleComancheCosta RicanCreeCreekCroatianCrowCubanCypriotCzechCzechoslovakianDanishDelawareDominicanDutchDutch West IndianEastern EuropeanEcuadorianEgyptianEnglishEstonianEthiopianEuropeanFijianFilipinoFinnishFrenchFrench American IndianFrench CanadianGermanGerman RussianGhanaianGreekGuamanian/ChamorroGuatemalanGuyaneseHaitianHmongHonduranHopiHoumaHungarianIcelanderIndian (Asian)IndonesianInupiatIranianIraqiIrishIroquoisIsraeliItalianJamaicanJapaneseJordanianKenyanKiowaKoreanLaotianLatvianLebaneseLiberianLithuanianLumbeeLuxembourgerMacedonianMalaysianMalteseMarshalleseMenomineeMexicanMexican American IndianMongolianMoroccanNative HawaiianNavajoNepaleseNew ZealanderNicaraguanNigerianNorthern EuropeanNorwegianOkinawanOsageOttawaPaiutePakistaniPalestinianPanamanianParaguayanPennsylvania GermanPeruvianPimaPolishPortuguesePotawatomiPuebloPuerto RicanPuget Sound SalishRomanianRussianSalvadoranSamoanScandinavianScotch-IrishScottishSeminoleSenegaleseSerbianShoshoneSierra LeoneanSiouxSlavicSlovakSloveneSomaliSouth AfricanSouth AmericanSouth American IndianSoviet UnionSpaniardSpanishSpanish AmericanSpanish American IndianSri LankanSubsaharan AfricanSudaneseSwedishSwissSyrianTaiwaneseThaiTlingit-HaidaTohono O'OdhamTonganTrinidadian and TobagonianTsimshianTurkishU.S. Virgin IslanderUgandanUkrainianUruguayanUteVenezuelanVietnameseWelshWest IndianYakamaYaquiYugoslavianYumanYup'ikZimbabwean
Immigration
NonimmigrantsImmigrantsAfghanistanAfricaAlbaniaArgentinaArmeniaAsiaAustraliaAustriaBahamasBangladeshBarbadosBelarusBelgiumBelizeBoliviaBosnia and HerzegovinaBrazilBulgariaBurma/MyanmarCabo VerdeCambodiaCameroonCanadaCaribbeanCentral AmericaChileChinaColombiaCongoCosta RicaCroatiaCubaCzechoslovakiaDenmarkDominicaDominican RepublicEastern AfricaEastern AsiaEastern EuropeEcuadorEgyptEl SalvadorEnglandEritreaEthiopiaEuropeFijiFranceGermanyGhanaGreeceGrenadaGuatemalaGuyanaHaitiHondurasHong KongHungaryIndiaIndonesiaIranIraqIrelandIsraelItalyJamaicaJapanJordanKazakhstanKenyaKoreaKuwaitLaosLatin AmericaLatviaLebanonLiberiaLithuaniaMalaysiaMexicoMicronesiaMiddle AfricaMoldovaMoroccoNepalNetherlandsNicaraguaNigeriaNorth AmericaNorth MacedoniaNorthern AfricaNorthern EuropeNorwayOceaniaPakistanPanamaPeruPhilippinesPolandPortugalRomaniaRussiaSaudi ArabiaScotlandSenegalSerbiaSierra LeoneSingaporeSomaliaSouth AfricaSouth AmericaSouth Central AsiaSouth Eastern AsiaSouthern EuropeSpainSri LankaSt. Vincent and the GrenadinesSudanSwedenSyriaTaiwanThailandTrinidad and TobagoTurkeyUgandaUkraineUruguayUzbekistanVenezuelaVietnamWest IndiesWestern AfricaWestern AsiaWestern EuropeYemenZaireZimbabweAzores
Self-Care Disability
Income
Poverty
Unemployment
Labor Participation
Family Structure
Vehicle Availability
Education Level
Disability

Immigrants from Switzerland Self-Care Disability
Exceptional

2.3%
SELF-CARE DISABILITY
99.1/ 100
METRIC RATING
74th/ 347
METRIC RANK

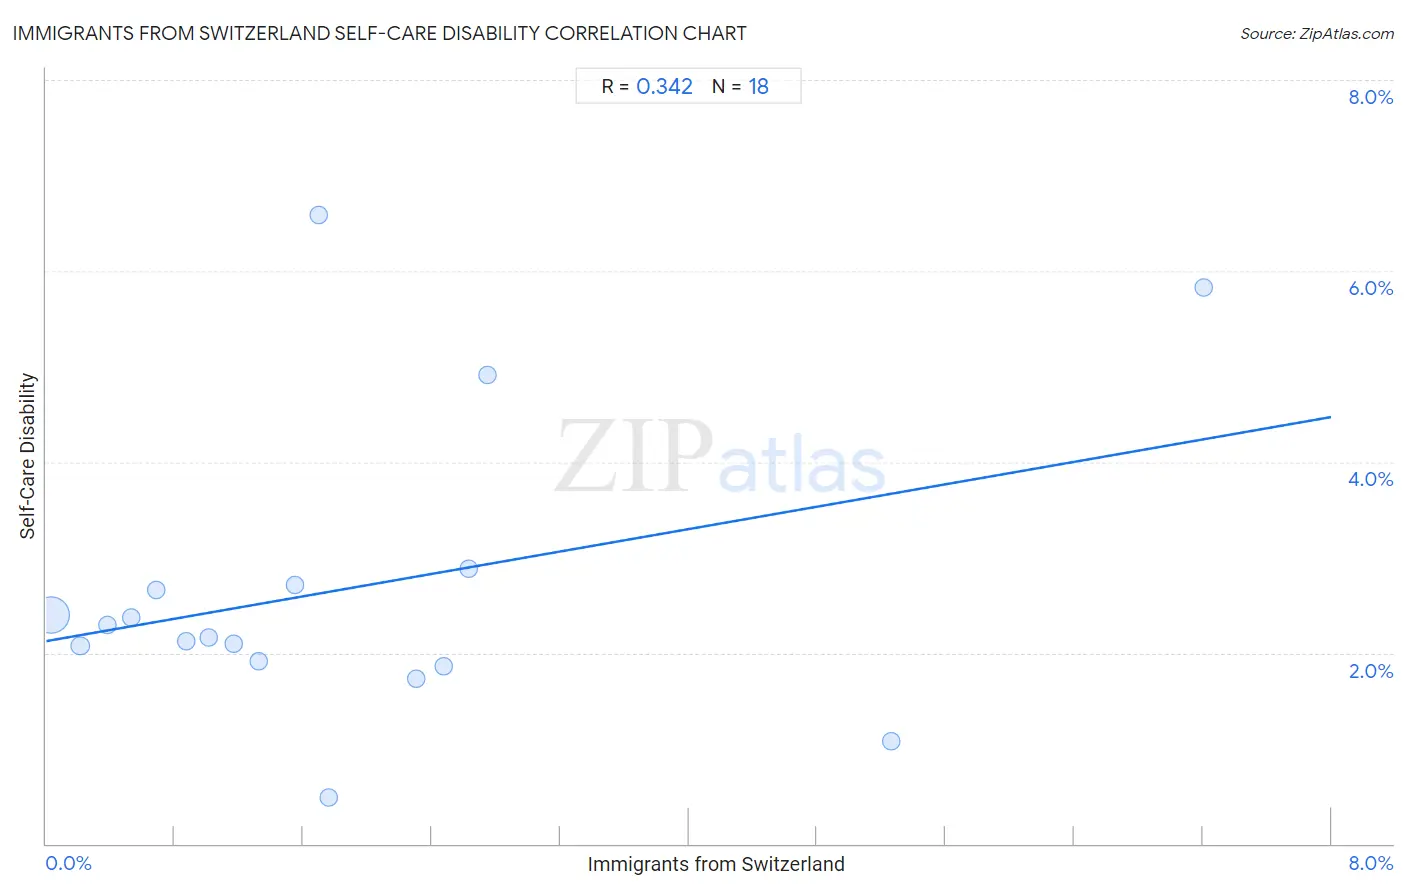
Immigrants from Switzerland Self-Care Disability Correlation Chart

The statistical analysis conducted on geographies consisting of 148,009,249 people shows a mild positive correlation between the proportion of Immigrants from Switzerland and percentage of population with self-care disability in the United States with a correlation coefficient (R) of 0.342 and weighted average of 2.3%. On average, for every 1% (one percent) increase in Immigrants from Switzerland within a typical geography, there is an increase of 0.29% in percentage of population with self-care disability.
Immigrants from Switzerland Self-Care Disability
It is essential to understand that the correlation between the percentage of Immigrants from Switzerland and percentage of population with self-care disability does not imply a direct cause-and-effect relationship. It remains uncertain whether the presence of Immigrants from Switzerland influences an upward or downward trend in the level of percentage of population with self-care disability within an area, or if Immigrants from Switzerland simply ended up residing in those areas with higher or lower levels of percentage of population with self-care disability due to other factors.

Demographics Similar to Immigrants from Switzerland by Self-Care Disability

In terms of self-care disability, the demographic groups most similar to Immigrants from Switzerland are Immigrants from Netherlands (2.3%, a difference of 0.040%), Immigrants from China (2.3%, a difference of 0.050%), Immigrants from Egypt (2.3%, a difference of 0.060%), Eastern European (2.3%, a difference of 0.090%), and Asian (2.3%, a difference of 0.12%).
DemographicsRating | RankSelf-Care Disability
South Africans
99.3
/100
|
#67
Exceptional
2.3%
Immigrants from Zaire
99.2
/100
|
#68
Exceptional
2.3%
Immigrants from Norway
99.2
/100
|
#69
Exceptional
2.3%
Immigrants from Northern Europe
99.2
/100
|
#70
Exceptional
2.3%
Asians
99.2
/100
|
#71
Exceptional
2.3%
Eastern Europeans
99.2
/100
|
#72
Exceptional
2.3%
Immigrants from Egypt
99.1
/100
|
#73
Exceptional
2.3%
Immigrants from Switzerland
99.1
/100
|
#74
Exceptional
2.3%
Immigrants from Netherlands
99.1
/100
|
#75
Exceptional
2.3%
Immigrants from China
99.1
/100
|
#76
Exceptional
2.3%
Immigrants from Middle Africa
99.0
/100
|
#77
Exceptional
2.3%
Immigrants from Ireland
99.0
/100
|
#78
Exceptional
2.3%
Immigrants from Kenya
99.0
/100
|
#79
Exceptional
2.3%
Chileans
98.8
/100
|
#80
Exceptional
2.3%
Ugandans
98.8
/100
|
#81
Exceptional
2.3%

Immigrants from Switzerland Self-Care Disability Correlation Summary

MeasurementImmigrants from Switzerland DataSelf-Care Disability Data
Minimum0.033%0.48%
Maximum7.2%6.6%
Range7.2%6.1%
Mean1.9%2.7%
Median1.4%2.2%
Interquartile 25% (IQ1)0.68%1.9%
Interquartile 75% (IQ3)2.5%2.7%
Interquartile Range (IQR)1.8%0.81%
Standard Deviation (Sample)1.8%1.6%
Standard Deviation (Population)1.8%1.5%

Correlation Details

Immigrants from Switzerland PercentileSample SizeSelf-Care Disability
[
0.0%
-
0.5%
]
0.033%
140,549,6762.4%
[
0.0%
-
0.5%
]
0.21%
5,740,5212.1%
[
0.0%
-
0.5%
]
0.38%
909,9112.3%
[
0.5%
-
1.0%
]
0.53%
372,9532.4%
[
0.5%
-
1.0%
]
0.68%
177,8032.7%
[
0.5%
-
1.0%
]
0.87%
133,7852.1%
[
1.0%
-
1.5%
]
1.01%
46,0132.2%
[
1.0%
-
1.5%
]
1.17%
31,8022.1%
[
1.0%
-
1.5%
]
1.32%
18,5551.9%
[
1.5%
-
2.0%
]
1.55%
10,2712.7%
[
1.5%
-
2.0%
]
1.70%
2,2356.6%
[
1.5%
-
2.0%
]
1.76%
2,7350.48%
[
2.0%
-
2.5%
]
2.31%
4,2951.7%
[
2.0%
-
2.5%
]
2.47%
4,4891.9%
[
2.5%
-
3.0%
]
2.63%
1,2562.9%
[
2.5%
-
3.0%
]
2.75%
2554.9%
[
5.0%
-
5.5%
]
5.26%
2,3751.1%
[
7.0%
-
7.5%
]
7.21%
3195.8%