African Self-Care Disability
COMPARE
African
Select to Compare
Self-Care Disability
African Self-Care Disability
2.7%
SELF-CARE DISABILITY
0.0/ 100
METRIC RATING
289th/ 347
METRIC RANK
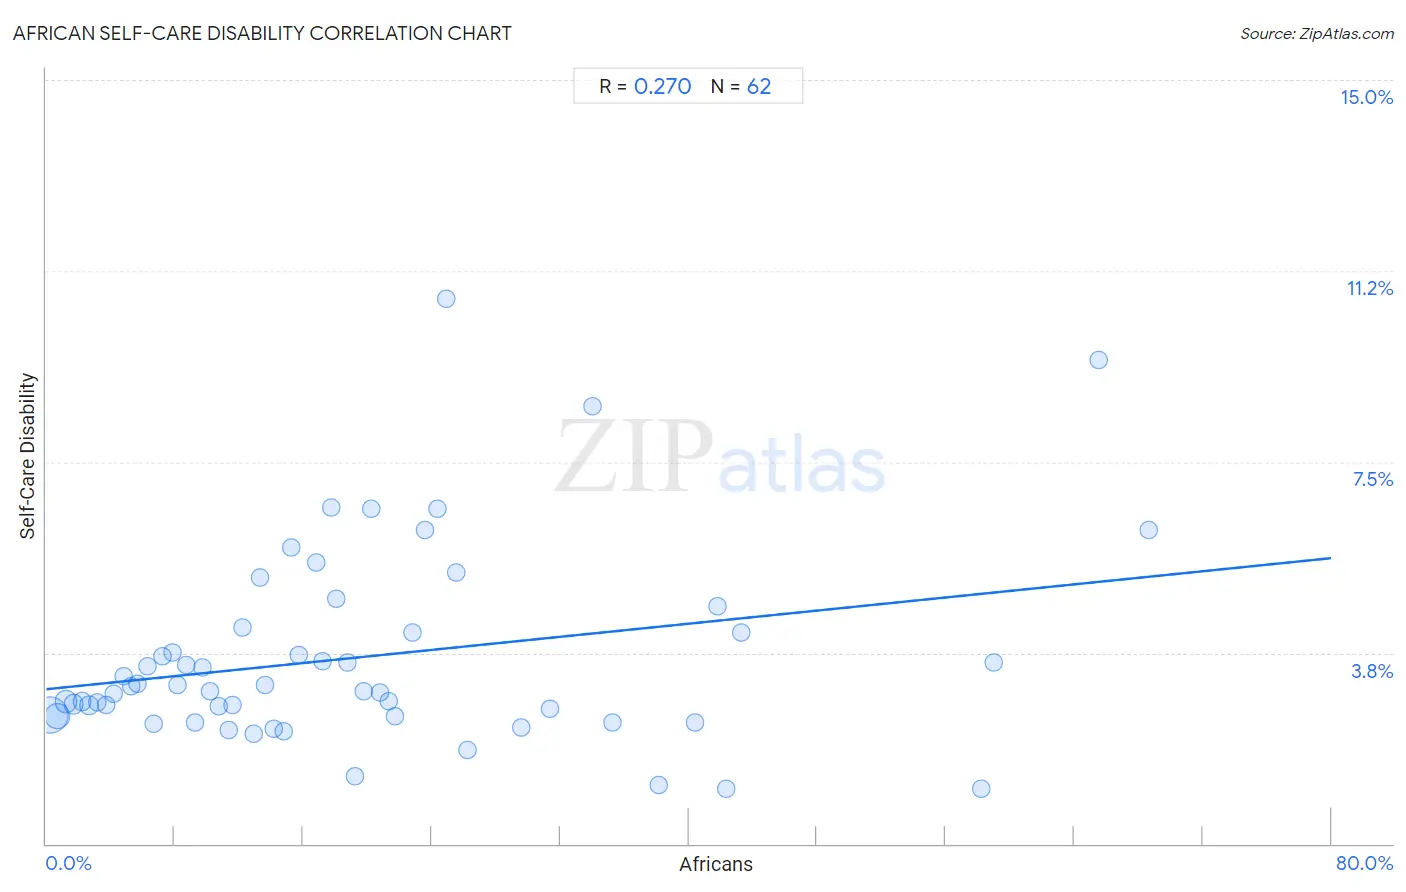
African Self-Care Disability Correlation Chart
The statistical analysis conducted on geographies consisting of 469,231,301 people shows a weak positive correlation between the proportion of Africans and percentage of population with self-care disability in the United States with a correlation coefficient (R) of 0.270 and weighted average of 2.7%. On average, for every 1% (one percent) increase in Africans within a typical geography, there is an increase of 0.032% in percentage of population with self-care disability.
It is essential to understand that the correlation between the percentage of Africans and percentage of population with self-care disability does not imply a direct cause-and-effect relationship. It remains uncertain whether the presence of Africans influences an upward or downward trend in the level of percentage of population with self-care disability within an area, or if Africans simply ended up residing in those areas with higher or lower levels of percentage of population with self-care disability due to other factors.
Demographics Similar to Africans by Self-Care Disability
In terms of self-care disability, the demographic groups most similar to Africans are Immigrants from Barbados (2.7%, a difference of 0.10%), Immigrants from Jamaica (2.7%, a difference of 0.14%), Cuban (2.7%, a difference of 0.15%), Guyanese (2.7%, a difference of 0.41%), and French American Indian (2.7%, a difference of 0.47%).
| Demographics | Rating | Rank | Self-Care Disability |
| Apache | 0.0 /100 | #282 | Tragic 2.7% |
| Delaware | 0.0 /100 | #283 | Tragic 2.7% |
| Fijians | 0.0 /100 | #284 | Tragic 2.7% |
| Jamaicans | 0.0 /100 | #285 | Tragic 2.7% |
| French American Indians | 0.0 /100 | #286 | Tragic 2.7% |
| Immigrants from Jamaica | 0.0 /100 | #287 | Tragic 2.7% |
| Immigrants from Barbados | 0.0 /100 | #288 | Tragic 2.7% |
| Africans | 0.0 /100 | #289 | Tragic 2.7% |
| Cubans | 0.0 /100 | #290 | Tragic 2.7% |
| Guyanese | 0.0 /100 | #291 | Tragic 2.7% |
| Central American Indians | 0.0 /100 | #292 | Tragic 2.7% |
| Belizeans | 0.0 /100 | #293 | Tragic 2.7% |
| Blackfeet | 0.0 /100 | #294 | Tragic 2.7% |
| Barbadians | 0.0 /100 | #295 | Tragic 2.7% |
| Immigrants from Portugal | 0.0 /100 | #296 | Tragic 2.8% |
African Self-Care Disability Correlation Summary
| Measurement | African Data | Self-Care Disability Data |
| Minimum | 0.21% | 1.1% |
| Maximum | 68.6% | 10.7% |
| Range | 68.4% | 9.6% |
| Mean | 19.4% | 3.7% |
| Median | 15.5% | 3.0% |
| Interquartile 25% (IQ1) | 7.8% | 2.5% |
| Interquartile 75% (IQ3) | 24.9% | 4.2% |
| Interquartile Range (IQR) | 17.1% | 1.6% |
| Standard Deviation (Sample) | 16.1% | 1.9% |
| Standard Deviation (Population) | 15.9% | 1.9% |
Correlation Details
| African Percentile | Sample Size | Self-Care Disability |
[ 0.0% - 0.5% ] 0.21% | 253,188,914 | 2.5% |
[ 0.5% - 1.0% ] 0.72% | 105,688,282 | 2.5% |
[ 1.0% - 1.5% ] 1.21% | 58,244,667 | 2.8% |
[ 1.5% - 2.0% ] 1.72% | 21,016,469 | 2.7% |
[ 2.0% - 2.5% ] 2.23% | 10,630,347 | 2.8% |
[ 2.5% - 3.0% ] 2.68% | 7,834,908 | 2.7% |
[ 3.0% - 3.5% ] 3.20% | 4,239,982 | 2.8% |
[ 3.5% - 4.0% ] 3.71% | 1,813,256 | 2.7% |
[ 4.0% - 4.5% ] 4.22% | 1,245,488 | 3.0% |
[ 4.5% - 5.0% ] 4.82% | 1,327,191 | 3.3% |
[ 5.0% - 5.5% ] 5.26% | 825,419 | 3.1% |
[ 5.5% - 6.0% ] 5.71% | 455,257 | 3.1% |
[ 6.0% - 6.5% ] 6.31% | 406,461 | 3.5% |
[ 6.5% - 7.0% ] 6.70% | 493,786 | 2.4% |
[ 7.0% - 7.5% ] 7.25% | 285,213 | 3.7% |
[ 7.5% - 8.0% ] 7.83% | 203,554 | 3.8% |
[ 8.0% - 8.5% ] 8.19% | 159,363 | 3.1% |
[ 8.5% - 9.0% ] 8.70% | 159,920 | 3.5% |
[ 9.0% - 9.5% ] 9.27% | 165,594 | 2.4% |
[ 9.5% - 10.0% ] 9.74% | 66,251 | 3.4% |
[ 10.0% - 10.5% ] 10.22% | 134,051 | 3.0% |
[ 10.5% - 11.0% ] 10.72% | 230,214 | 2.7% |
[ 11.0% - 11.5% ] 11.37% | 8,710 | 2.2% |
[ 11.5% - 12.0% ] 11.63% | 26,234 | 2.7% |
[ 12.0% - 12.5% ] 12.23% | 11,708 | 4.2% |
[ 12.5% - 13.0% ] 12.93% | 23,227 | 2.2% |
[ 13.0% - 13.5% ] 13.31% | 4,891 | 5.2% |
[ 13.5% - 14.0% ] 13.66% | 3,749 | 3.1% |
[ 14.0% - 14.5% ] 14.17% | 15,888 | 2.3% |
[ 14.5% - 15.0% ] 14.77% | 103,882 | 2.2% |
[ 15.0% - 15.5% ] 15.28% | 22,936 | 5.8% |
[ 15.5% - 16.0% ] 15.73% | 11,087 | 3.7% |
[ 16.5% - 17.0% ] 16.77% | 6,510 | 5.5% |
[ 17.0% - 17.5% ] 17.21% | 16,222 | 3.6% |
[ 17.5% - 18.0% ] 17.74% | 2,672 | 6.6% |
[ 18.0% - 18.5% ] 18.06% | 40,302 | 4.8% |
[ 18.5% - 19.0% ] 18.74% | 19,765 | 3.6% |
[ 19.0% - 19.5% ] 19.22% | 385 | 1.3% |
[ 19.5% - 20.0% ] 19.79% | 9,956 | 3.0% |
[ 20.0% - 20.5% ] 20.24% | 3,305 | 6.6% |
[ 20.5% - 21.0% ] 20.81% | 3,239 | 3.0% |
[ 21.0% - 21.5% ] 21.32% | 15,443 | 2.8% |
[ 21.5% - 22.0% ] 21.72% | 7,110 | 2.5% |
[ 22.5% - 23.0% ] 22.81% | 8,194 | 4.2% |
[ 23.5% - 24.0% ] 23.56% | 365 | 6.2% |
[ 24.0% - 24.5% ] 24.38% | 24,894 | 6.6% |
[ 24.5% - 25.0% ] 24.91% | 273 | 10.7% |
[ 25.5% - 26.0% ] 25.54% | 881 | 5.3% |
[ 26.0% - 26.5% ] 26.24% | 2,138 | 1.8% |
[ 29.5% - 30.0% ] 29.55% | 44 | 2.3% |
[ 31.0% - 31.5% ] 31.35% | 2,485 | 2.6% |
[ 34.0% - 34.5% ] 34.01% | 1,476 | 8.6% |
[ 35.0% - 35.5% ] 35.23% | 1,286 | 2.4% |
[ 38.0% - 38.5% ] 38.10% | 4,572 | 1.1% |
[ 40.0% - 40.5% ] 40.41% | 9,613 | 2.4% |
[ 41.5% - 42.0% ] 41.76% | 613 | 4.7% |
[ 42.0% - 42.5% ] 42.31% | 338 | 1.1% |
[ 43.0% - 43.5% ] 43.29% | 633 | 4.1% |
[ 58.0% - 58.5% ] 58.19% | 574 | 1.1% |
[ 59.0% - 59.5% ] 59.02% | 549 | 3.6% |
[ 65.5% - 66.0% ] 65.55% | 479 | 9.5% |
[ 68.5% - 69.0% ] 68.60% | 86 | 6.2% |