Alsatian Self-Care Disability
COMPARE
Alsatian
Select to Compare
Self-Care Disability
Alsatian Self-Care Disability
2.4%
SELF-CARE DISABILITY
94.9/ 100
METRIC RATING
103rd/ 347
METRIC RANK
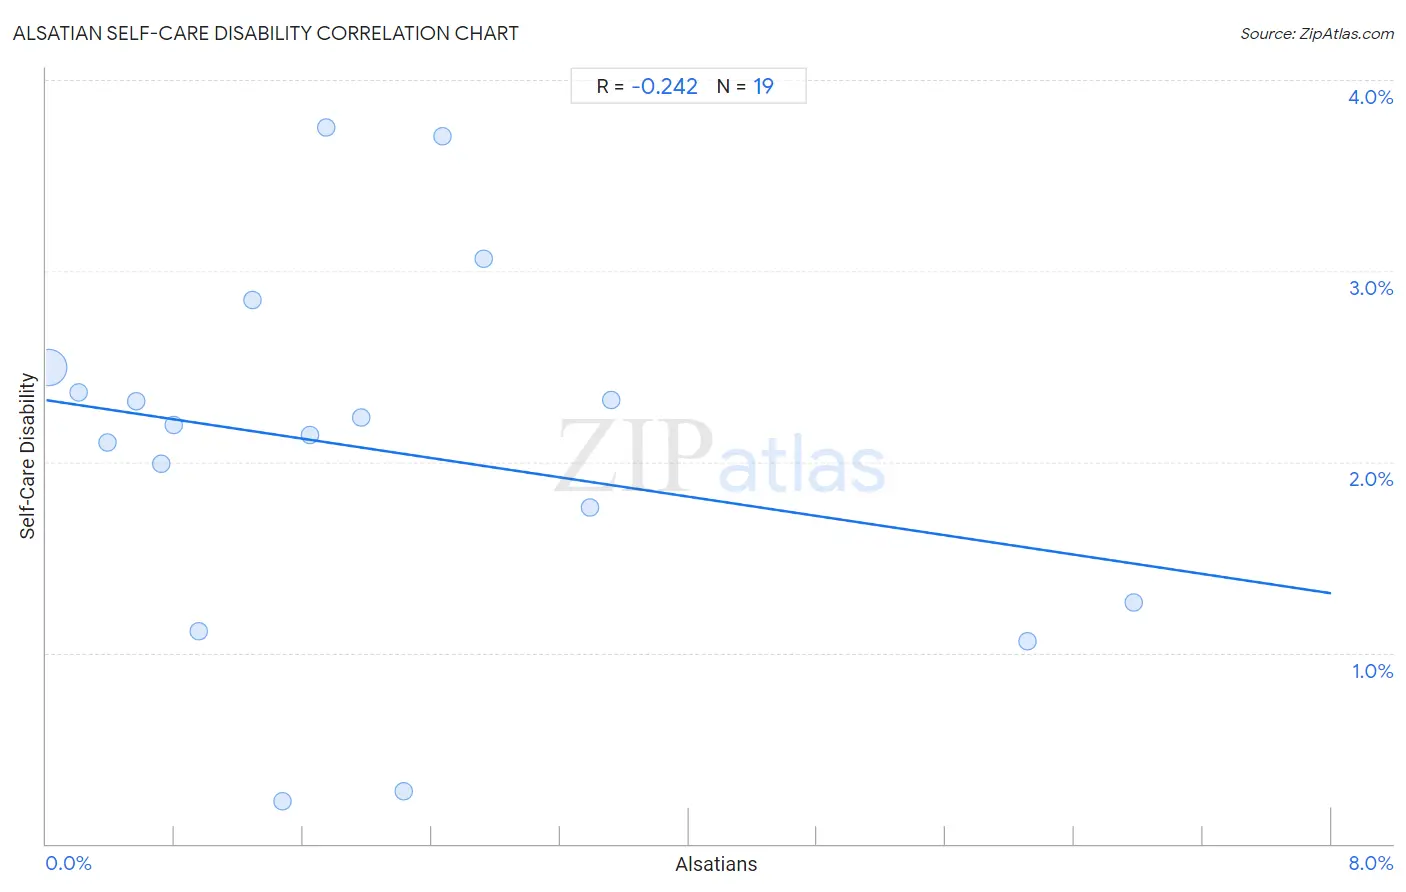
Alsatian Self-Care Disability Correlation Chart
The statistical analysis conducted on geographies consisting of 82,671,639 people shows a weak negative correlation between the proportion of Alsatians and percentage of population with self-care disability in the United States with a correlation coefficient (R) of -0.242 and weighted average of 2.4%. On average, for every 1% (one percent) increase in Alsatians within a typical geography, there is a decrease of 0.13% in percentage of population with self-care disability.
It is essential to understand that the correlation between the percentage of Alsatians and percentage of population with self-care disability does not imply a direct cause-and-effect relationship. It remains uncertain whether the presence of Alsatians influences an upward or downward trend in the level of percentage of population with self-care disability within an area, or if Alsatians simply ended up residing in those areas with higher or lower levels of percentage of population with self-care disability due to other factors.
Demographics Similar to Alsatians by Self-Care Disability
In terms of self-care disability, the demographic groups most similar to Alsatians are Croatian (2.4%, a difference of 0.030%), Bhutanese (2.4%, a difference of 0.10%), Carpatho Rusyn (2.4%, a difference of 0.13%), Immigrants from Indonesia (2.4%, a difference of 0.14%), and British (2.4%, a difference of 0.15%).
| Demographics | Rating | Rank | Self-Care Disability |
| Immigrants from Chile | 96.7 /100 | #96 | Exceptional 2.4% |
| Swiss | 96.6 /100 | #97 | Exceptional 2.4% |
| Immigrants from Poland | 96.4 /100 | #98 | Exceptional 2.4% |
| Immigrants from Israel | 96.1 /100 | #99 | Exceptional 2.4% |
| Europeans | 95.8 /100 | #100 | Exceptional 2.4% |
| Immigrants from Scotland | 95.7 /100 | #101 | Exceptional 2.4% |
| Croatians | 95.0 /100 | #102 | Exceptional 2.4% |
| Alsatians | 94.9 /100 | #103 | Exceptional 2.4% |
| Bhutanese | 94.5 /100 | #104 | Exceptional 2.4% |
| Carpatho Rusyns | 94.4 /100 | #105 | Exceptional 2.4% |
| Immigrants from Indonesia | 94.3 /100 | #106 | Exceptional 2.4% |
| British | 94.3 /100 | #107 | Exceptional 2.4% |
| Greeks | 94.1 /100 | #108 | Exceptional 2.4% |
| Slovenes | 94.1 /100 | #109 | Exceptional 2.4% |
| Immigrants from Africa | 93.7 /100 | #110 | Exceptional 2.4% |
Alsatian Self-Care Disability Correlation Summary
| Measurement | Alsatian Data | Self-Care Disability Data |
| Minimum | 0.016% | 0.22% |
| Maximum | 6.8% | 3.7% |
| Range | 6.8% | 3.5% |
| Mean | 2.0% | 2.1% |
| Median | 1.6% | 2.2% |
| Interquartile 25% (IQ1) | 0.72% | 1.3% |
| Interquartile 75% (IQ3) | 2.7% | 2.5% |
| Interquartile Range (IQR) | 2.0% | 1.2% |
| Standard Deviation (Sample) | 1.9% | 0.97% |
| Standard Deviation (Population) | 1.8% | 0.94% |
Correlation Details
| Alsatian Percentile | Sample Size | Self-Care Disability |
[ 0.0% - 0.5% ] 0.016% | 81,405,599 | 2.5% |
[ 0.0% - 0.5% ] 0.20% | 923,531 | 2.4% |
[ 0.0% - 0.5% ] 0.38% | 113,092 | 2.1% |
[ 0.5% - 1.0% ] 0.56% | 118,815 | 2.3% |
[ 0.5% - 1.0% ] 0.72% | 32,091 | 2.0% |
[ 0.5% - 1.0% ] 0.79% | 41,713 | 2.2% |
[ 0.5% - 1.0% ] 0.95% | 5,784 | 1.1% |
[ 1.0% - 1.5% ] 1.29% | 4,355 | 2.8% |
[ 1.0% - 1.5% ] 1.47% | 2,792 | 0.22% |
[ 1.5% - 2.0% ] 1.64% | 3,540 | 2.1% |
[ 1.5% - 2.0% ] 1.75% | 1,604 | 3.7% |
[ 1.5% - 2.0% ] 1.96% | 715 | 2.2% |
[ 2.0% - 2.5% ] 2.23% | 1,573 | 0.28% |
[ 2.0% - 2.5% ] 2.47% | 243 | 3.7% |
[ 2.5% - 3.0% ] 2.73% | 1,321 | 3.1% |
[ 3.0% - 3.5% ] 3.39% | 827 | 1.8% |
[ 3.5% - 4.0% ] 3.52% | 1,848 | 2.3% |
[ 6.0% - 6.5% ] 6.11% | 2,994 | 1.1% |
[ 6.5% - 7.0% ] 6.77% | 9,202 | 1.3% |