Immigrants from Micronesia Self-Care Disability
COMPARE
Immigrants from Micronesia
Select to Compare
Self-Care Disability
Immigrants from Micronesia Self-Care Disability
2.7%
SELF-CARE DISABILITY
0.1/ 100
METRIC RATING
270th/ 347
METRIC RANK
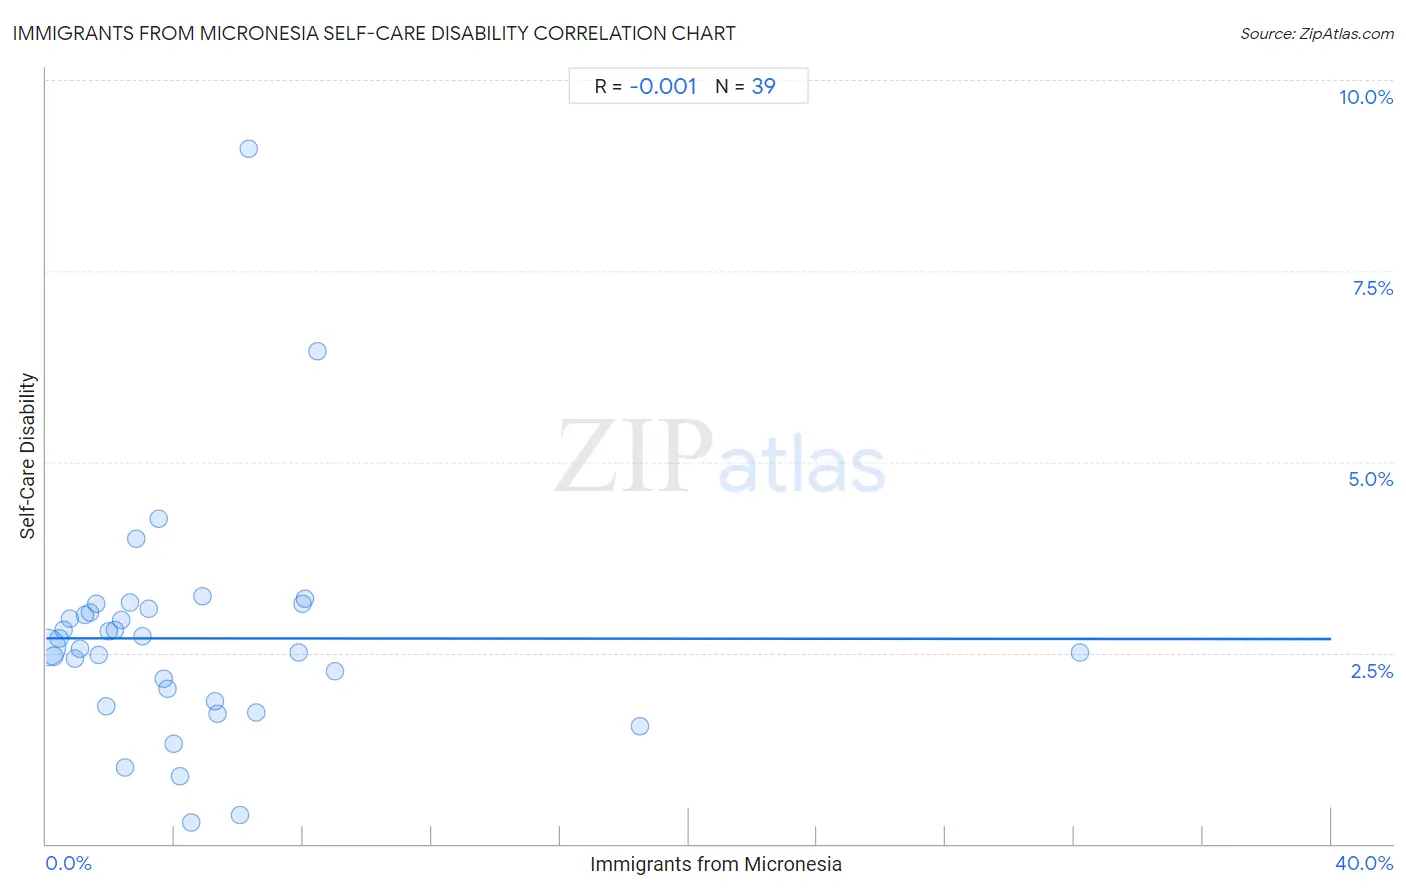
Immigrants from Micronesia Self-Care Disability Correlation Chart
The statistical analysis conducted on geographies consisting of 61,544,733 people shows no correlation between the proportion of Immigrants from Micronesia and percentage of population with self-care disability in the United States with a correlation coefficient (R) of -0.001 and weighted average of 2.7%. On average, for every 1% (one percent) increase in Immigrants from Micronesia within a typical geography, there is a decrease of 0.00024% in percentage of population with self-care disability.
It is essential to understand that the correlation between the percentage of Immigrants from Micronesia and percentage of population with self-care disability does not imply a direct cause-and-effect relationship. It remains uncertain whether the presence of Immigrants from Micronesia influences an upward or downward trend in the level of percentage of population with self-care disability within an area, or if Immigrants from Micronesia simply ended up residing in those areas with higher or lower levels of percentage of population with self-care disability due to other factors.
Demographics Similar to Immigrants from Micronesia by Self-Care Disability
In terms of self-care disability, the demographic groups most similar to Immigrants from Micronesia are U.S. Virgin Islander (2.7%, a difference of 0.040%), Trinidadian and Tobagonian (2.7%, a difference of 0.060%), Immigrants from Laos (2.7%, a difference of 0.10%), Immigrants from Mexico (2.7%, a difference of 0.21%), and Mexican (2.7%, a difference of 0.24%).
| Demographics | Rating | Rank | Self-Care Disability |
| Immigrants from Latin America | 0.2 /100 | #263 | Tragic 2.7% |
| Immigrants from Iran | 0.2 /100 | #264 | Tragic 2.7% |
| Immigrants from Nicaragua | 0.2 /100 | #265 | Tragic 2.7% |
| Immigrants from Cambodia | 0.1 /100 | #266 | Tragic 2.7% |
| Yaqui | 0.1 /100 | #267 | Tragic 2.7% |
| Immigrants from Mexico | 0.1 /100 | #268 | Tragic 2.7% |
| U.S. Virgin Islanders | 0.1 /100 | #269 | Tragic 2.7% |
| Immigrants from Micronesia | 0.1 /100 | #270 | Tragic 2.7% |
| Trinidadians and Tobagonians | 0.1 /100 | #271 | Tragic 2.7% |
| Immigrants from Laos | 0.1 /100 | #272 | Tragic 2.7% |
| Mexicans | 0.1 /100 | #273 | Tragic 2.7% |
| Yakama | 0.1 /100 | #274 | Tragic 2.7% |
| Immigrants from Trinidad and Tobago | 0.1 /100 | #275 | Tragic 2.7% |
| Japanese | 0.1 /100 | #276 | Tragic 2.7% |
| Immigrants from Ukraine | 0.1 /100 | #277 | Tragic 2.7% |
Immigrants from Micronesia Self-Care Disability Correlation Summary
| Measurement | Immigrants from Micronesia Data | Self-Care Disability Data |
| Minimum | 0.022% | 0.28% |
| Maximum | 32.2% | 9.1% |
| Range | 32.1% | 8.8% |
| Mean | 4.7% | 2.7% |
| Median | 3.2% | 2.6% |
| Interquartile 25% (IQ1) | 1.6% | 1.9% |
| Interquartile 75% (IQ3) | 6.0% | 3.1% |
| Interquartile Range (IQR) | 4.5% | 1.2% |
| Standard Deviation (Sample) | 5.7% | 1.5% |
| Standard Deviation (Population) | 5.6% | 1.5% |
Correlation Details
| Immigrants from Micronesia Percentile | Sample Size | Self-Care Disability |
[ 0.0% - 0.5% ] 0.022% | 53,330,523 | 2.6% |
[ 0.0% - 0.5% ] 0.22% | 3,447,462 | 2.5% |
[ 0.0% - 0.5% ] 0.39% | 1,633,111 | 2.7% |
[ 0.5% - 1.0% ] 0.54% | 908,170 | 2.8% |
[ 0.5% - 1.0% ] 0.73% | 517,730 | 2.9% |
[ 0.5% - 1.0% ] 0.90% | 465,458 | 2.4% |
[ 1.0% - 1.5% ] 1.05% | 183,115 | 2.5% |
[ 1.0% - 1.5% ] 1.22% | 79,622 | 3.0% |
[ 1.0% - 1.5% ] 1.35% | 37,868 | 3.0% |
[ 1.5% - 2.0% ] 1.56% | 129,643 | 3.1% |
[ 1.5% - 2.0% ] 1.63% | 382,524 | 2.5% |
[ 1.5% - 2.0% ] 1.86% | 10,989 | 1.8% |
[ 1.5% - 2.0% ] 1.95% | 667 | 2.8% |
[ 2.0% - 2.5% ] 2.13% | 133,478 | 2.8% |
[ 2.0% - 2.5% ] 2.33% | 78,526 | 2.9% |
[ 2.0% - 2.5% ] 2.46% | 1,907 | 1.0% |
[ 2.5% - 3.0% ] 2.59% | 55,473 | 3.2% |
[ 2.5% - 3.0% ] 2.81% | 3,701 | 4.0% |
[ 2.5% - 3.0% ] 2.99% | 8,254 | 2.7% |
[ 3.0% - 3.5% ] 3.19% | 58,742 | 3.1% |
[ 3.0% - 3.5% ] 3.48% | 9,702 | 4.3% |
[ 3.5% - 4.0% ] 3.66% | 9,383 | 2.2% |
[ 3.5% - 4.0% ] 3.79% | 10,786 | 2.0% |
[ 3.5% - 4.0% ] 3.95% | 11,207 | 1.3% |
[ 4.0% - 4.5% ] 4.17% | 624 | 0.89% |
[ 4.5% - 5.0% ] 4.52% | 1,129 | 0.28% |
[ 4.5% - 5.0% ] 4.87% | 10,042 | 3.2% |
[ 5.0% - 5.5% ] 5.26% | 2,356 | 1.9% |
[ 5.0% - 5.5% ] 5.31% | 414 | 1.7% |
[ 6.0% - 6.5% ] 6.04% | 844 | 0.38% |
[ 6.0% - 6.5% ] 6.28% | 2,005 | 9.1% |
[ 6.5% - 7.0% ] 6.53% | 3,477 | 1.7% |
[ 7.5% - 8.0% ] 7.87% | 4,842 | 2.5% |
[ 7.5% - 8.0% ] 7.96% | 5,391 | 3.1% |
[ 8.0% - 8.5% ] 8.05% | 2,820 | 3.2% |
[ 8.0% - 8.5% ] 8.44% | 379 | 6.5% |
[ 8.5% - 9.0% ] 9.00% | 1,278 | 2.3% |
[ 18.0% - 18.5% ] 18.47% | 693 | 1.5% |
[ 32.0% - 32.5% ] 32.16% | 398 | 2.5% |