Immigrants from Cambodia Self-Care Disability

COMPARE

Immigrants from Cambodia
Race
Ancestry
AfghanAfricanAlaska NativeAlaskan AthabascanAlbanianAleutAlsatianAmericanApacheArabArapahoArgentineanArmenianAssyrian/Chaldean/SyriacAustralianAustrianBahamianBangladeshiBarbadianBasqueBelgianBelizeanBermudanBhutaneseBlackfeetBolivianBrazilianBritishBritish West IndianBulgarianBurmeseCajunCambodianCanadianCape VerdeanCarpatho RusynCelticCentral AmericanCentral American IndianCherokeeCheyenneChickasawChileanChineseChippewaChoctawColombianColvilleComancheCosta RicanCreeCreekCroatianCrowCubanCypriotCzechCzechoslovakianDanishDelawareDominicanDutchDutch West IndianEastern EuropeanEcuadorianEgyptianEnglishEstonianEthiopianEuropeanFijianFilipinoFinnishFrenchFrench American IndianFrench CanadianGermanGerman RussianGhanaianGreekGuamanian/ChamorroGuatemalanGuyaneseHaitianHmongHonduranHopiHoumaHungarianIcelanderIndian (Asian)IndonesianInupiatIranianIraqiIrishIroquoisIsraeliItalianJamaicanJapaneseJordanianKenyanKiowaKoreanLaotianLatvianLebaneseLiberianLithuanianLumbeeLuxembourgerMacedonianMalaysianMalteseMarshalleseMenomineeMexicanMexican American IndianMongolianMoroccanNative HawaiianNavajoNepaleseNew ZealanderNicaraguanNigerianNorthern EuropeanNorwegianOkinawanOsageOttawaPaiutePakistaniPalestinianPanamanianParaguayanPennsylvania GermanPeruvianPimaPolishPortuguesePotawatomiPuebloPuerto RicanPuget Sound SalishRomanianRussianSalvadoranSamoanScandinavianScotch-IrishScottishSeminoleSenegaleseSerbianShoshoneSierra LeoneanSiouxSlavicSlovakSloveneSomaliSouth AfricanSouth AmericanSouth American IndianSoviet UnionSpaniardSpanishSpanish AmericanSpanish American IndianSri LankanSubsaharan AfricanSudaneseSwedishSwissSyrianTaiwaneseThaiTlingit-HaidaTohono O'OdhamTonganTrinidadian and TobagonianTsimshianTurkishU.S. Virgin IslanderUgandanUkrainianUruguayanUteVenezuelanVietnameseWelshWest IndianYakamaYaquiYugoslavianYumanYup'ikZimbabwean
Immigration
NonimmigrantsImmigrantsAfghanistanAfricaAlbaniaArgentinaArmeniaAsiaAustraliaAustriaBahamasBangladeshBarbadosBelarusBelgiumBelizeBoliviaBosnia and HerzegovinaBrazilBulgariaBurma/MyanmarCabo VerdeCambodiaCameroonCanadaCaribbeanCentral AmericaChileChinaColombiaCongoCosta RicaCroatiaCubaCzechoslovakiaDenmarkDominicaDominican RepublicEastern AfricaEastern AsiaEastern EuropeEcuadorEgyptEl SalvadorEnglandEritreaEthiopiaEuropeFijiFranceGermanyGhanaGreeceGrenadaGuatemalaGuyanaHaitiHondurasHong KongHungaryIndiaIndonesiaIranIraqIrelandIsraelItalyJamaicaJapanJordanKazakhstanKenyaKoreaKuwaitLaosLatin AmericaLatviaLebanonLiberiaLithuaniaMalaysiaMexicoMicronesiaMiddle AfricaMoldovaMoroccoNepalNetherlandsNicaraguaNigeriaNorth AmericaNorth MacedoniaNorthern AfricaNorthern EuropeNorwayOceaniaPakistanPanamaPeruPhilippinesPolandPortugalRomaniaRussiaSaudi ArabiaScotlandSenegalSerbiaSierra LeoneSingaporeSomaliaSouth AfricaSouth AmericaSouth Central AsiaSouth Eastern AsiaSouthern EuropeSpainSri LankaSt. Vincent and the GrenadinesSudanSwedenSwitzerlandSyriaTaiwanThailandTrinidad and TobagoTurkeyUgandaUkraineUruguayUzbekistanVenezuelaVietnamWest IndiesWestern AfricaWestern AsiaWestern EuropeYemenZaireZimbabweAzores
Select to Compare
Race
Ancestry
AfghanAfricanAlaska NativeAlaskan AthabascanAlbanianAleutAlsatianAmericanApacheArabArapahoArgentineanArmenianAssyrian/Chaldean/SyriacAustralianAustrianBahamianBangladeshiBarbadianBasqueBelgianBelizeanBermudanBhutaneseBlackfeetBolivianBrazilianBritishBritish West IndianBulgarianBurmeseCajunCambodianCanadianCape VerdeanCarpatho RusynCelticCentral AmericanCentral American IndianCherokeeCheyenneChickasawChileanChineseChippewaChoctawColombianColvilleComancheCosta RicanCreeCreekCroatianCrowCubanCypriotCzechCzechoslovakianDanishDelawareDominicanDutchDutch West IndianEastern EuropeanEcuadorianEgyptianEnglishEstonianEthiopianEuropeanFijianFilipinoFinnishFrenchFrench American IndianFrench CanadianGermanGerman RussianGhanaianGreekGuamanian/ChamorroGuatemalanGuyaneseHaitianHmongHonduranHopiHoumaHungarianIcelanderIndian (Asian)IndonesianInupiatIranianIraqiIrishIroquoisIsraeliItalianJamaicanJapaneseJordanianKenyanKiowaKoreanLaotianLatvianLebaneseLiberianLithuanianLumbeeLuxembourgerMacedonianMalaysianMalteseMarshalleseMenomineeMexicanMexican American IndianMongolianMoroccanNative HawaiianNavajoNepaleseNew ZealanderNicaraguanNigerianNorthern EuropeanNorwegianOkinawanOsageOttawaPaiutePakistaniPalestinianPanamanianParaguayanPennsylvania GermanPeruvianPimaPolishPortuguesePotawatomiPuebloPuerto RicanPuget Sound SalishRomanianRussianSalvadoranSamoanScandinavianScotch-IrishScottishSeminoleSenegaleseSerbianShoshoneSierra LeoneanSiouxSlavicSlovakSloveneSomaliSouth AfricanSouth AmericanSouth American IndianSoviet UnionSpaniardSpanishSpanish AmericanSpanish American IndianSri LankanSubsaharan AfricanSudaneseSwedishSwissSyrianTaiwaneseThaiTlingit-HaidaTohono O'OdhamTonganTrinidadian and TobagonianTsimshianTurkishU.S. Virgin IslanderUgandanUkrainianUruguayanUteVenezuelanVietnameseWelshWest IndianYakamaYaquiYugoslavianYumanYup'ikZimbabwean
Immigration
NonimmigrantsImmigrantsAfghanistanAfricaAlbaniaArgentinaArmeniaAsiaAustraliaAustriaBahamasBangladeshBarbadosBelarusBelgiumBelizeBoliviaBosnia and HerzegovinaBrazilBulgariaBurma/MyanmarCabo VerdeCameroonCanadaCaribbeanCentral AmericaChileChinaColombiaCongoCosta RicaCroatiaCubaCzechoslovakiaDenmarkDominicaDominican RepublicEastern AfricaEastern AsiaEastern EuropeEcuadorEgyptEl SalvadorEnglandEritreaEthiopiaEuropeFijiFranceGermanyGhanaGreeceGrenadaGuatemalaGuyanaHaitiHondurasHong KongHungaryIndiaIndonesiaIranIraqIrelandIsraelItalyJamaicaJapanJordanKazakhstanKenyaKoreaKuwaitLaosLatin AmericaLatviaLebanonLiberiaLithuaniaMalaysiaMexicoMicronesiaMiddle AfricaMoldovaMoroccoNepalNetherlandsNicaraguaNigeriaNorth AmericaNorth MacedoniaNorthern AfricaNorthern EuropeNorwayOceaniaPakistanPanamaPeruPhilippinesPolandPortugalRomaniaRussiaSaudi ArabiaScotlandSenegalSerbiaSierra LeoneSingaporeSomaliaSouth AfricaSouth AmericaSouth Central AsiaSouth Eastern AsiaSouthern EuropeSpainSri LankaSt. Vincent and the GrenadinesSudanSwedenSwitzerlandSyriaTaiwanThailandTrinidad and TobagoTurkeyUgandaUkraineUruguayUzbekistanVenezuelaVietnamWest IndiesWestern AfricaWestern AsiaWestern EuropeYemenZaireZimbabweAzores
Self-Care Disability
Income
Poverty
Unemployment
Labor Participation
Family Structure
Vehicle Availability
Education Level
Disability

Immigrants from Cambodia Self-Care Disability
Tragic

2.7%
SELF-CARE DISABILITY
0.1/ 100
METRIC RATING
266th/ 347
METRIC RANK

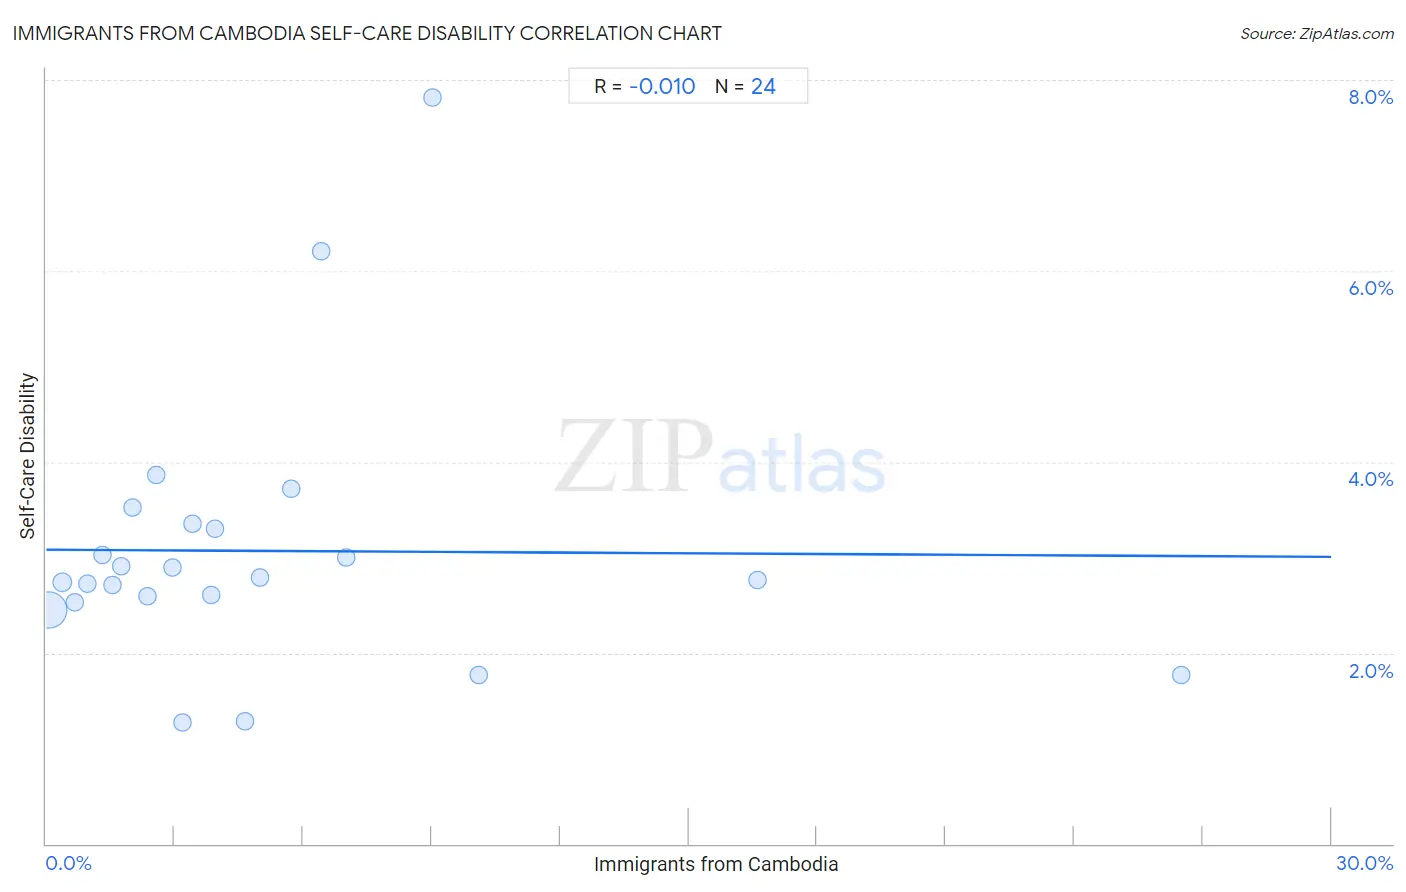
Immigrants from Cambodia Self-Care Disability Correlation Chart

The statistical analysis conducted on geographies consisting of 205,114,644 people shows no correlation between the proportion of Immigrants from Cambodia and percentage of population with self-care disability in the United States with a correlation coefficient (R) of -0.010 and weighted average of 2.7%. On average, for every 1% (one percent) increase in Immigrants from Cambodia within a typical geography, there is a decrease of 0.0025% in percentage of population with self-care disability.
Immigrants from Cambodia Self-Care Disability
It is essential to understand that the correlation between the percentage of Immigrants from Cambodia and percentage of population with self-care disability does not imply a direct cause-and-effect relationship. It remains uncertain whether the presence of Immigrants from Cambodia influences an upward or downward trend in the level of percentage of population with self-care disability within an area, or if Immigrants from Cambodia simply ended up residing in those areas with higher or lower levels of percentage of population with self-care disability due to other factors.

Demographics Similar to Immigrants from Cambodia by Self-Care Disability

In terms of self-care disability, the demographic groups most similar to Immigrants from Cambodia are Immigrants from Nicaragua (2.7%, a difference of 0.050%), Yaqui (2.7%, a difference of 0.19%), Immigrants from Iran (2.7%, a difference of 0.21%), Immigrants from Mexico (2.7%, a difference of 0.24%), and Immigrants from Latin America (2.7%, a difference of 0.27%).
DemographicsRating | RankSelf-Care Disability
Immigrants from Belarus
0.2
/100
|
#259
Tragic
2.6%
Chippewa
0.2
/100
|
#260
Tragic
2.6%
Arapaho
0.2
/100
|
#261
Tragic
2.6%
Shoshone
0.2
/100
|
#262
Tragic
2.7%
Immigrants from Latin America
0.2
/100
|
#263
Tragic
2.7%
Immigrants from Iran
0.2
/100
|
#264
Tragic
2.7%
Immigrants from Nicaragua
0.2
/100
|
#265
Tragic
2.7%
Immigrants from Cambodia
0.1
/100
|
#266
Tragic
2.7%
Yaqui
0.1
/100
|
#267
Tragic
2.7%
Immigrants from Mexico
0.1
/100
|
#268
Tragic
2.7%
U.S. Virgin Islanders
0.1
/100
|
#269
Tragic
2.7%
Immigrants from Micronesia
0.1
/100
|
#270
Tragic
2.7%
Trinidadians and Tobagonians
0.1
/100
|
#271
Tragic
2.7%
Immigrants from Laos
0.1
/100
|
#272
Tragic
2.7%
Mexicans
0.1
/100
|
#273
Tragic
2.7%

Immigrants from Cambodia Self-Care Disability Correlation Summary

MeasurementImmigrants from Cambodia DataSelf-Care Disability Data
Minimum0.067%1.3%
Maximum26.5%7.8%
Range26.4%6.5%
Mean5.1%3.1%
Median3.3%2.8%
Interquartile 25% (IQ1)1.6%2.6%
Interquartile 75% (IQ3)6.1%3.3%
Interquartile Range (IQR)4.4%0.76%
Standard Deviation (Sample)5.9%1.4%
Standard Deviation (Population)5.8%1.4%

Correlation Details

Immigrants from Cambodia PercentileSample SizeSelf-Care Disability
[
0.0%
-
0.5%
]
0.067%
180,839,2352.5%
[
0.0%
-
0.5%
]
0.38%
16,210,7252.7%
[
0.5%
-
1.0%
]
0.67%
3,945,2632.5%
[
0.5%
-
1.0%
]
0.96%
1,710,9462.7%
[
1.0%
-
1.5%
]
1.30%
763,0903.0%
[
1.5%
-
2.0%
]
1.53%
226,4512.7%
[
1.5%
-
2.0%
]
1.76%
539,5872.9%
[
2.0%
-
2.5%
]
2.02%
175,2343.5%
[
2.0%
-
2.5%
]
2.36%
93,7382.6%
[
2.5%
-
3.0%
]
2.56%
178,5873.9%
[
2.5%
-
3.0%
]
2.95%
113,2172.9%
[
3.0%
-
3.5%
]
3.19%
2,7941.3%
[
3.0%
-
3.5%
]
3.43%
69,9953.3%
[
3.5%
-
4.0%
]
3.85%
28,1992.6%
[
3.5%
-
4.0%
]
3.95%
58,4943.3%
[
4.5%
-
5.0%
]
4.63%
2,0501.3%
[
4.5%
-
5.0%
]
4.99%
1,0632.8%
[
5.5%
-
6.0%
]
5.71%
3,5753.7%
[
6.0%
-
6.5%
]
6.41%
2,2156.2%
[
7.0%
-
7.5%
]
7.00%
115,1483.0%
[
9.0%
-
9.5%
]
9.02%
1,5757.8%
[
10.0%
-
10.5%
]
10.10%
9211.8%
[
16.5%
-
17.0%
]
16.60%
32,3232.8%
[
26.0%
-
26.5%
]
26.48%
2191.8%